Checking Automation Status
The Automations view provides a timeline of automation executions across all configured code locations that are associated with Open iT components. This view guides you to verify that scheduled automations are running as expected and identify any failed executions that may affect data collection, processing, or reporting.
To check the status of automation:
-
Access the Core Server web interface.
-
Once the web interface is loaded, click the menu icon located at the top part of the page. Click Data Processing GUI from the dropdown menu.
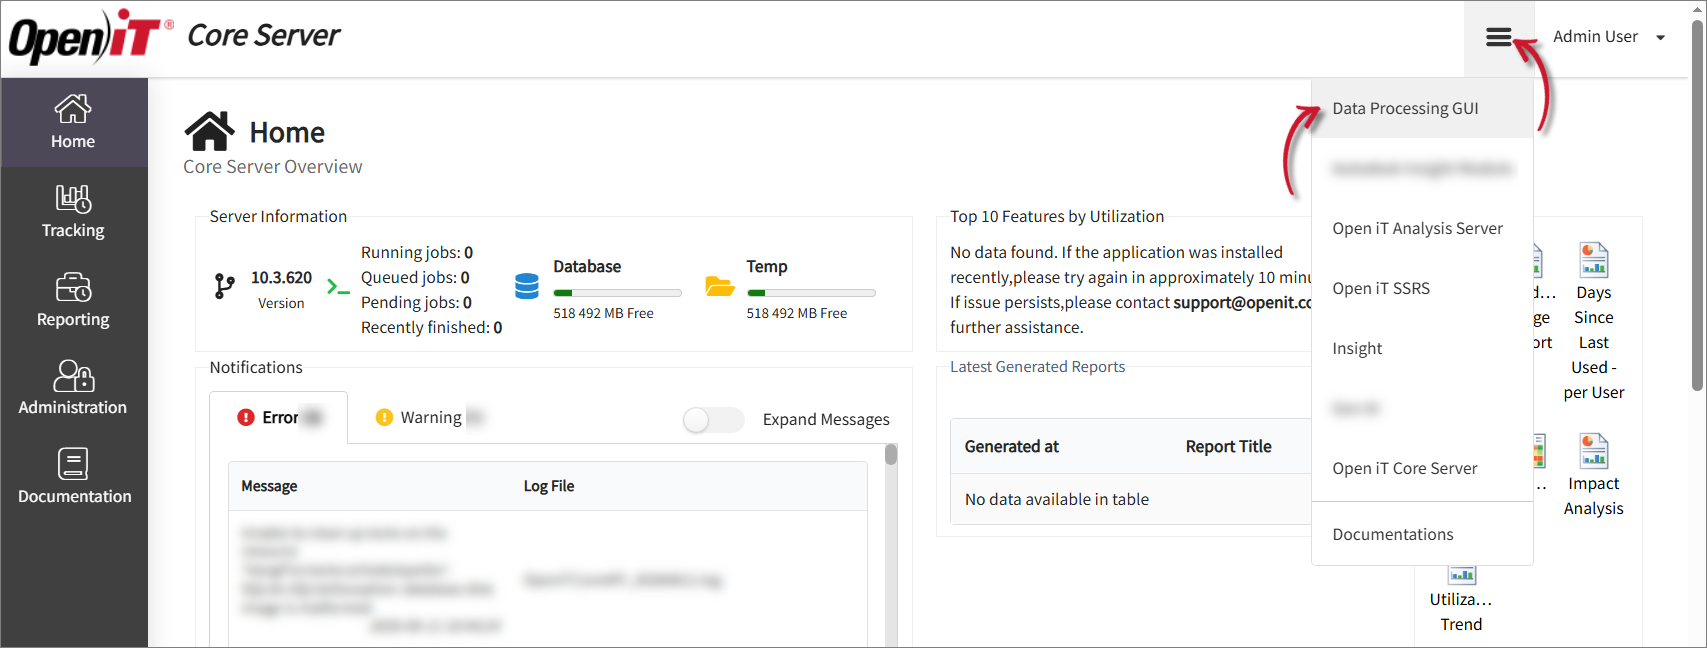 Click Data Processing GUI
 -
Go to the Timeline tab, then select Automations from the dropdown menu located at the upper-left part of the page.
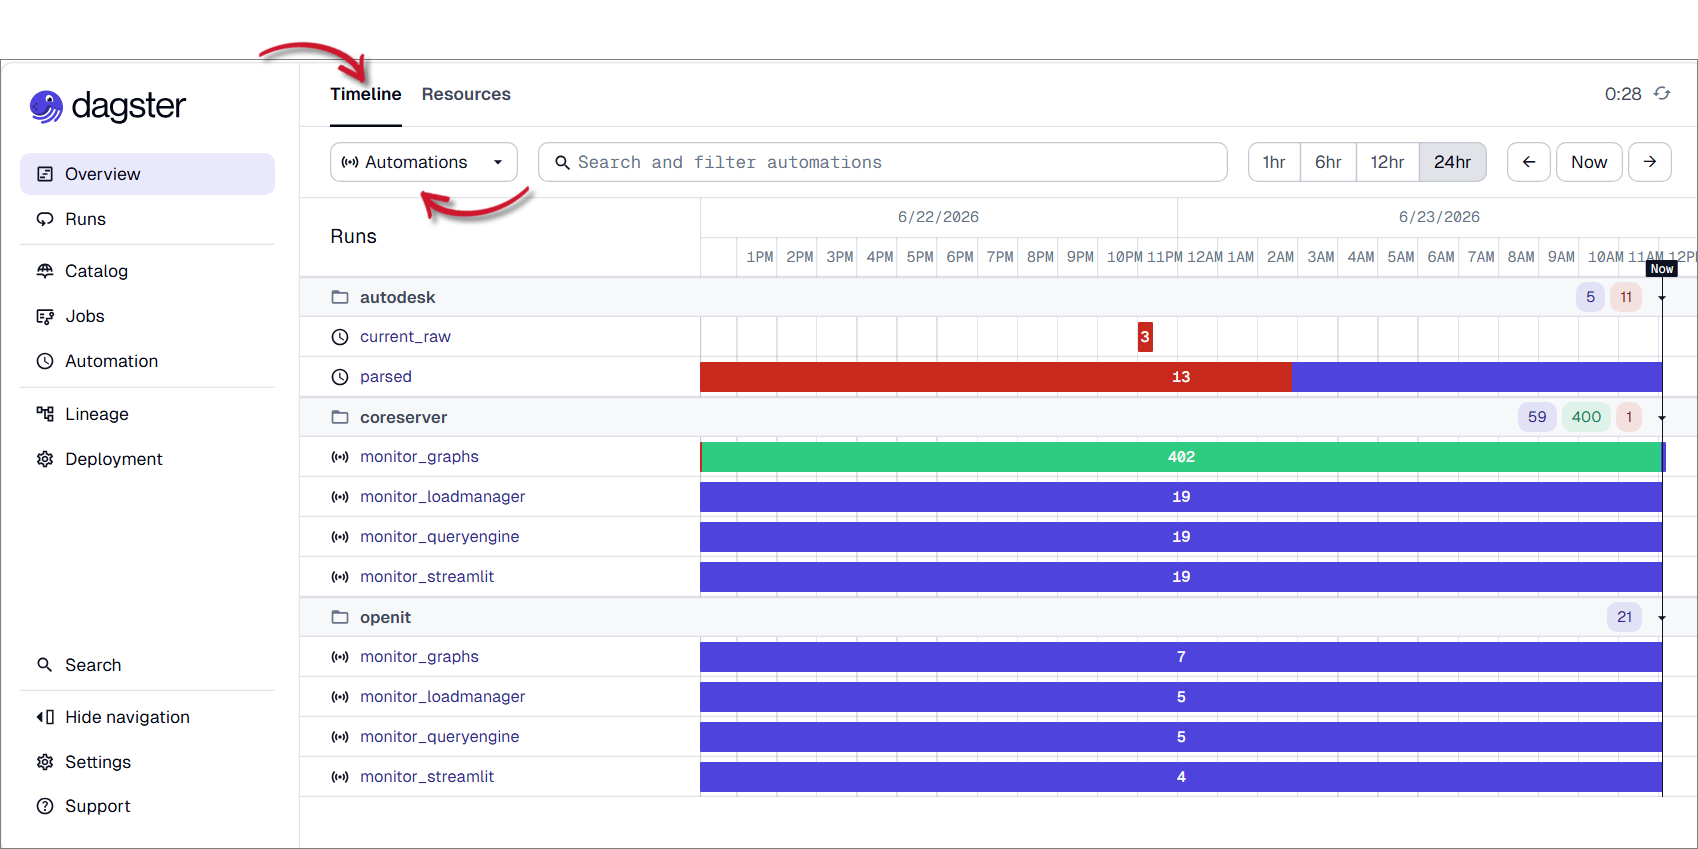 Navigate to Automations
 -
Check the automations listed under the Runs section. You may use the available time filters (e.g.
1hr,6hr,12hr, and24 hr) to adjust the displayed period.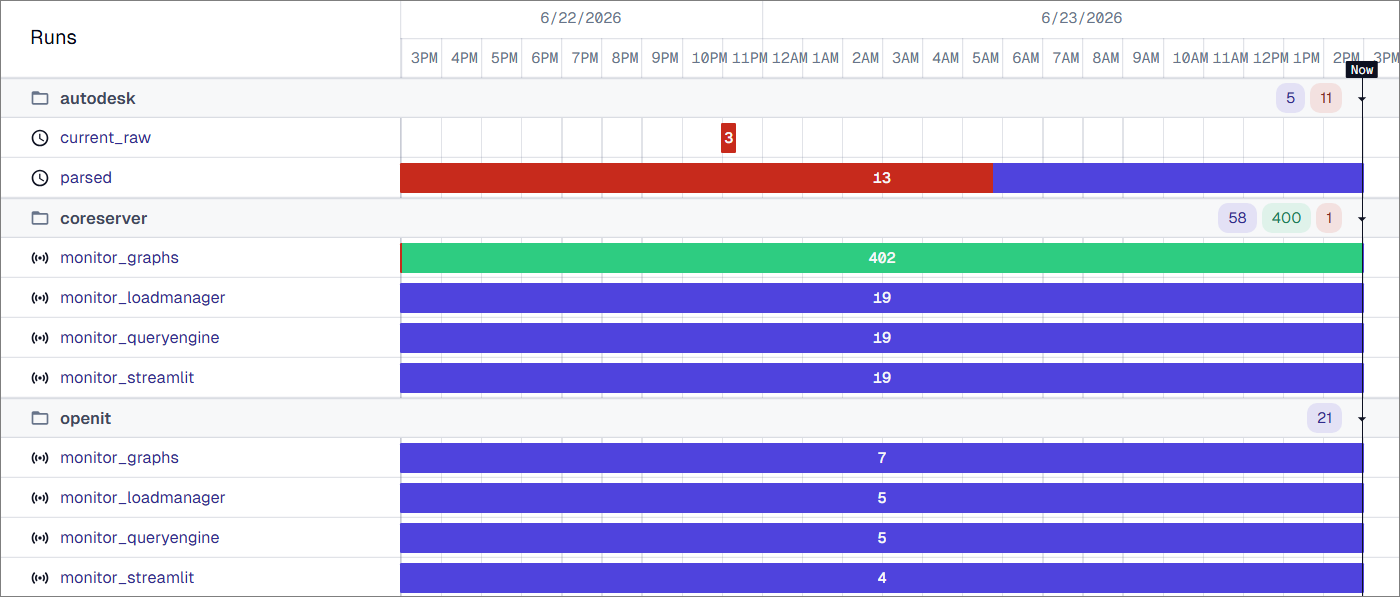 Check Automations Table
Each row represents an automation that may contains the following:
Indicator Description This indicates successful executions. This indicates in-progress executions. This indicates failed executions. Automation Status Indicators
In the example:
- the parsed automation under
autodeskcode location contains multiple failed executions - the automations under
coreservercode location have in-progress executions and a successful execution (monitor_graphs) - the automations under
openitcode location have in-progress executions
If an automation failed, click the affected automation to review additional details.
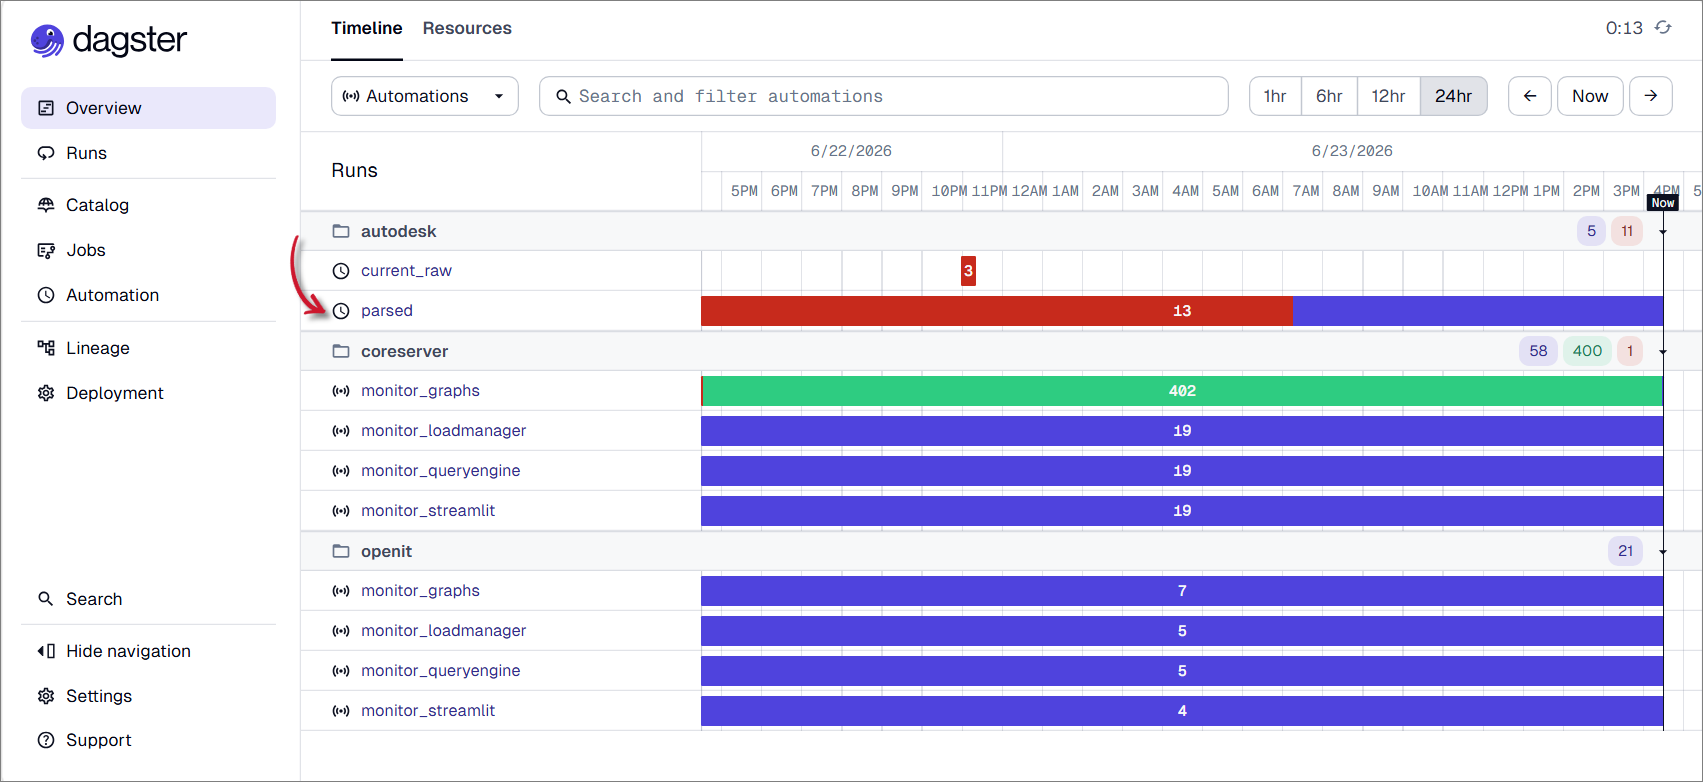 Click the Failed Automation
You may review the following information:
- Automation Details – Displays information about the selected automation, including its scheduled configuration and execution frequency.
Review this section to verify that the automation is configured correctly and scheduled to run at the expected intervals.
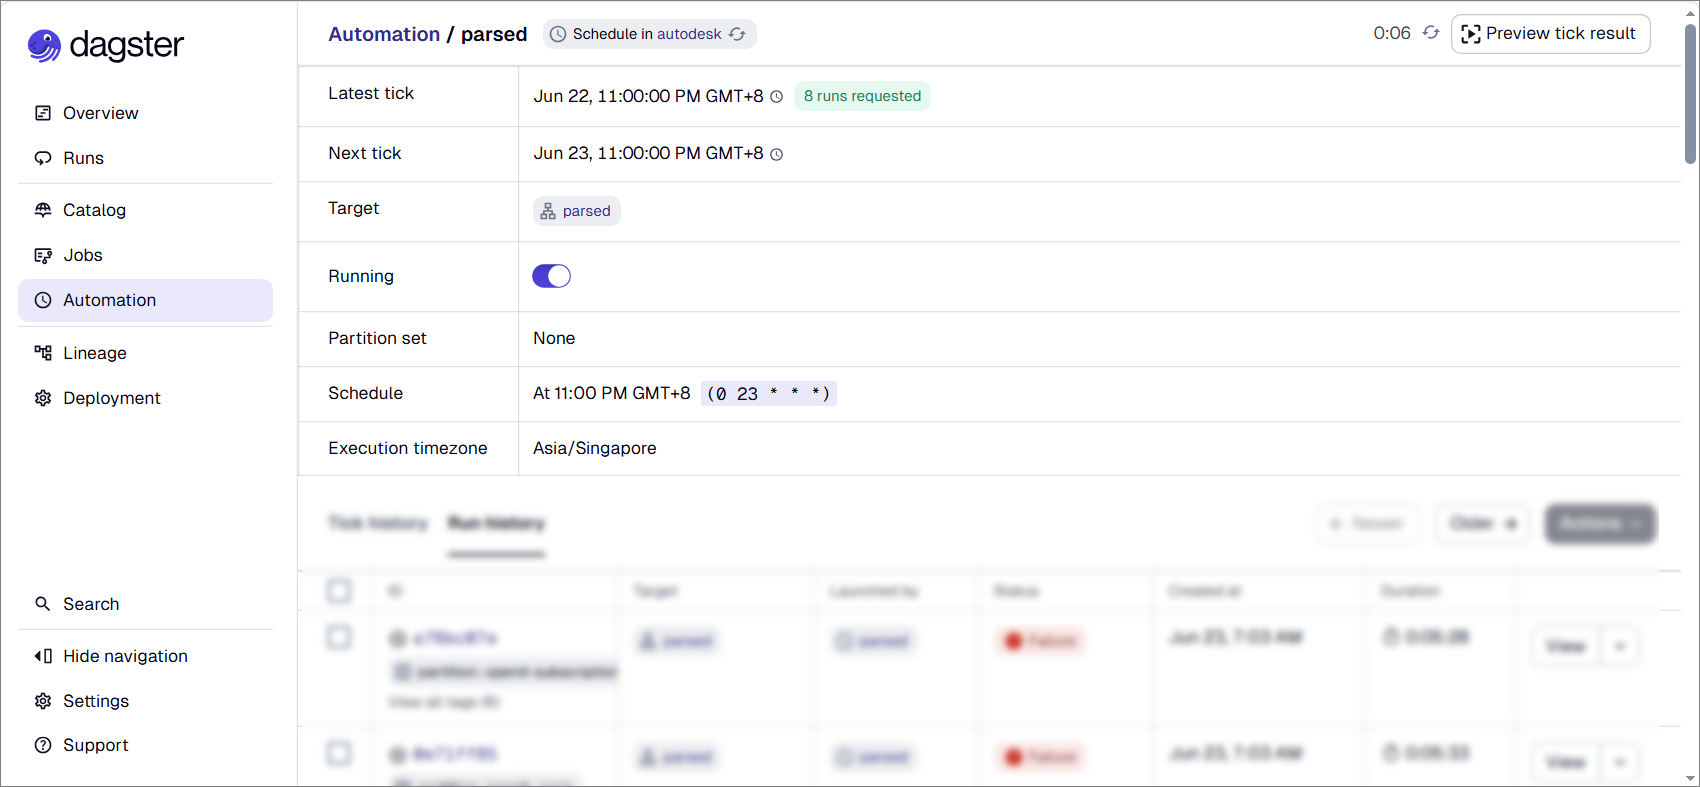 Review Automation Details
- Run History – Displays the execution history of the automation, including run timestamps, duration, and execution status.
Review this section to identify recurring failures, determine when an issue first occurred, and confirm whether recent executions completed successfully.
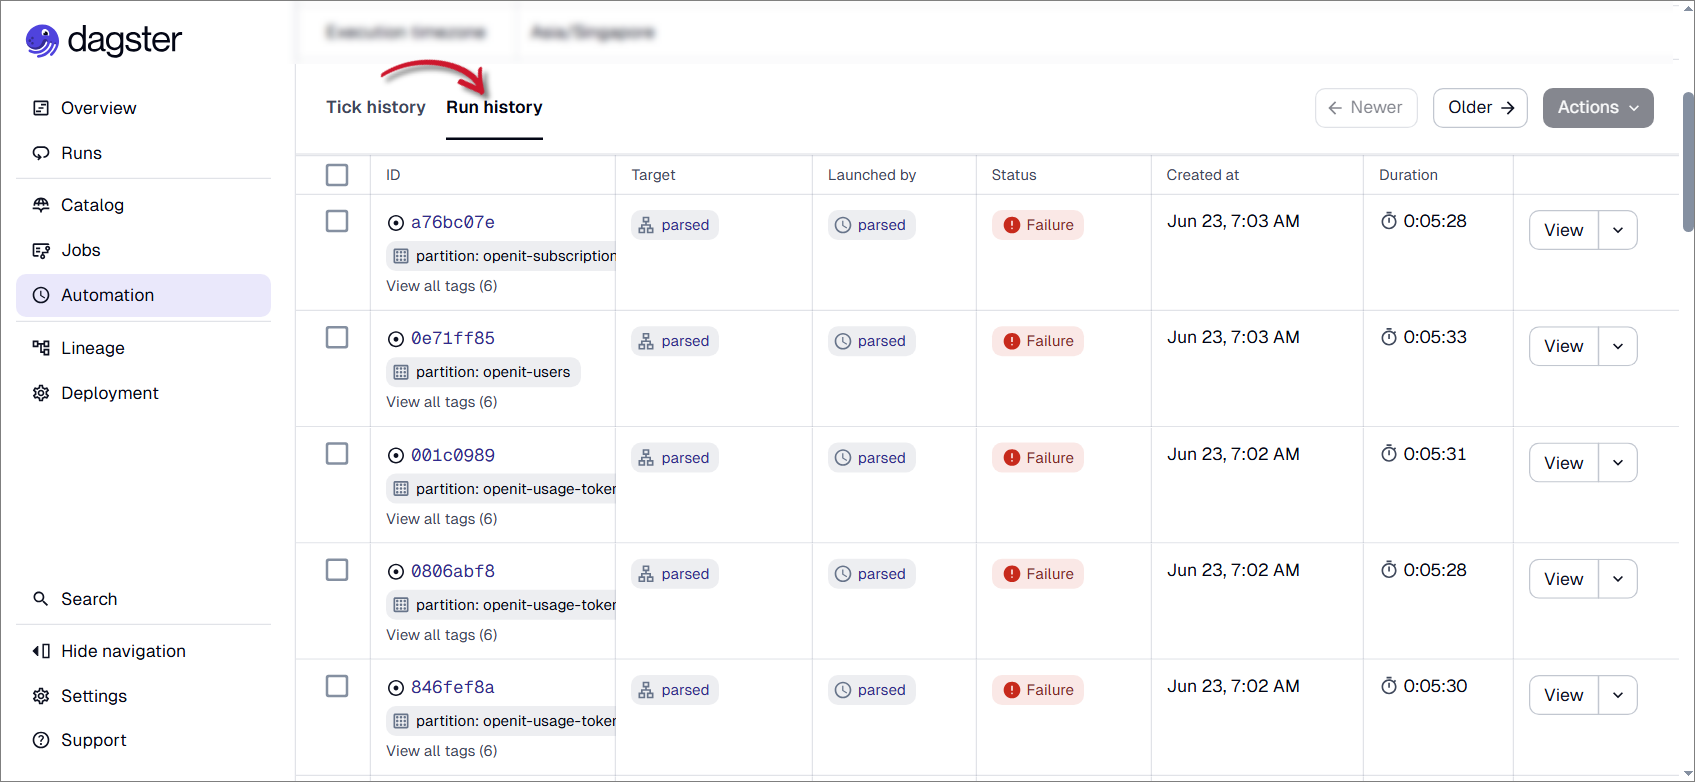 Review Run History
To investigate a failed execution, click View at the end of the corresponding row. This opens the Runs page, where you can review execution logs, error messages, and other diagnostic information that may help identify the root cause of the failure.
- the parsed automation under
If the error cannot be resolved using the available logs or troubleshooting steps, kindly reach out to the Support Team for further assistance.