Checking Asset
Assets represent data, processes, or resources produced and maintained by Open iT components. This guides you in verifying that assets are being updated successfully and identifying assets that may have stale, missing, or failed materializations.
Checking Asset Operational Status
To check the operational status of an asset:
-
Access the Core Server web interface.
-
Once the web interface is loaded, click the menu icon located at the top part of the page. Click Data Processing GUI from the dropdown menu.
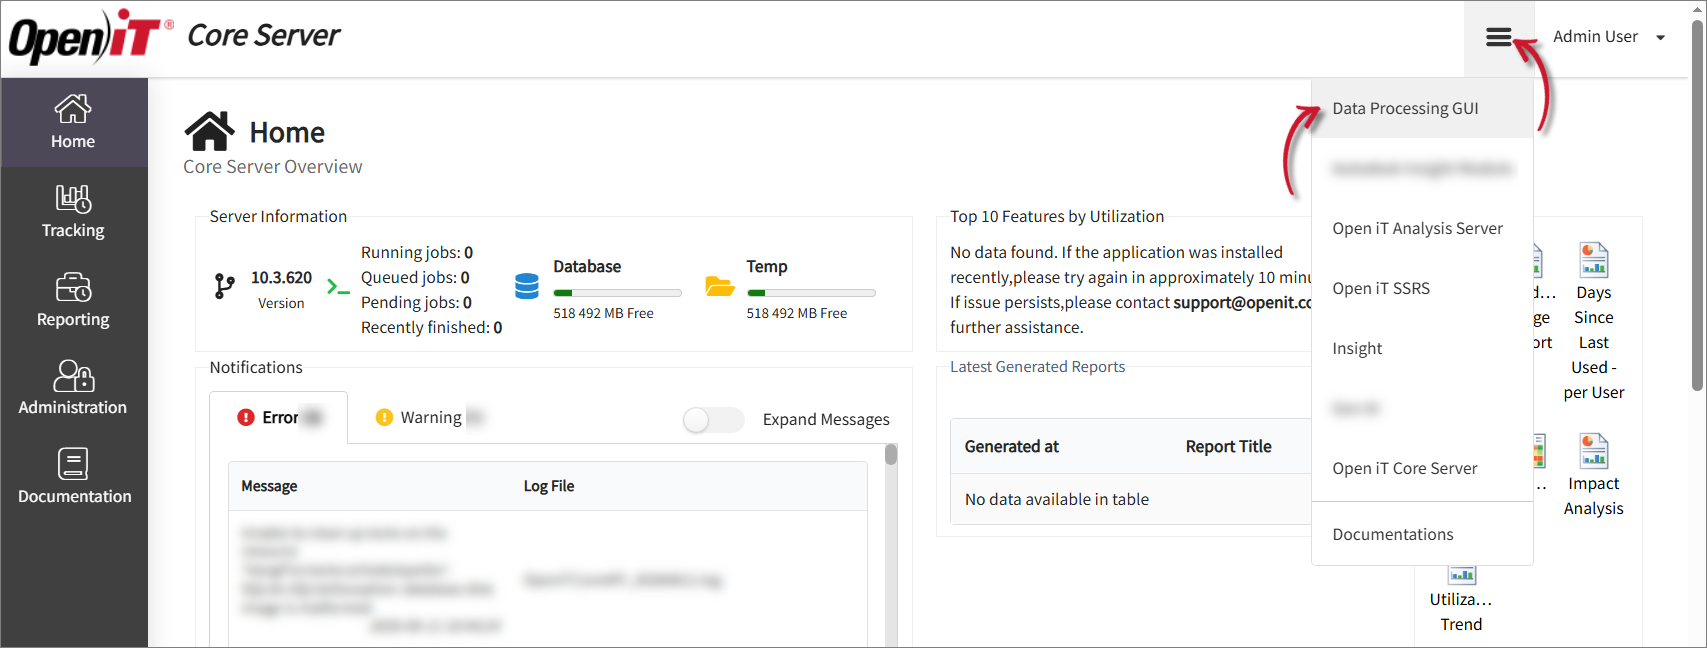 Click Data Processing GUI
 -
In the left navigation pane, select Lineage.
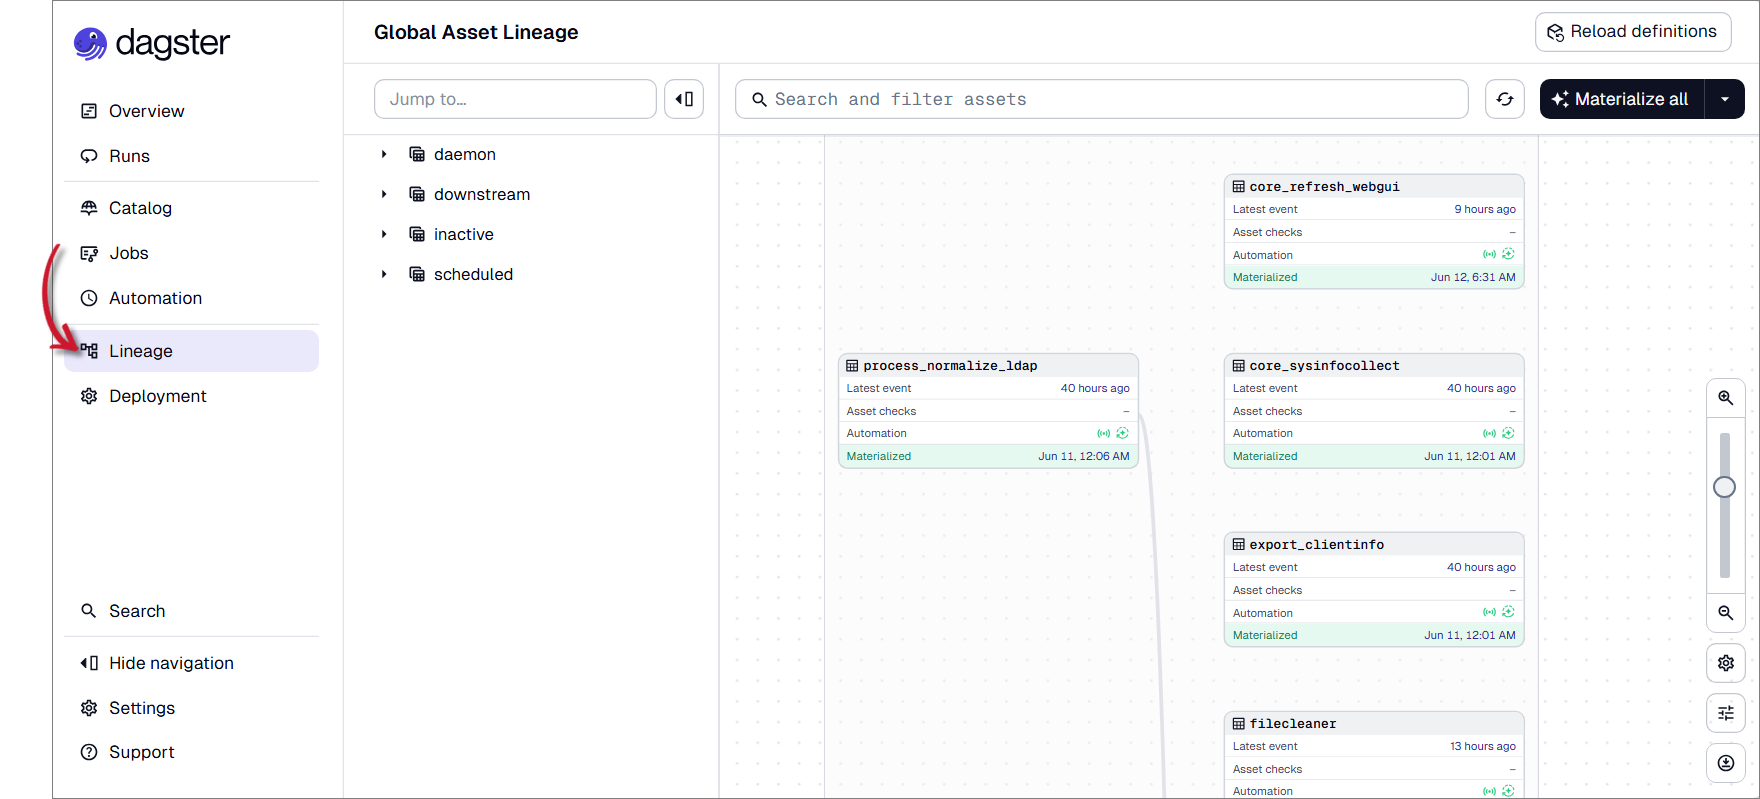 Select Lineage
 -
Select the asset, then review the following operational details:
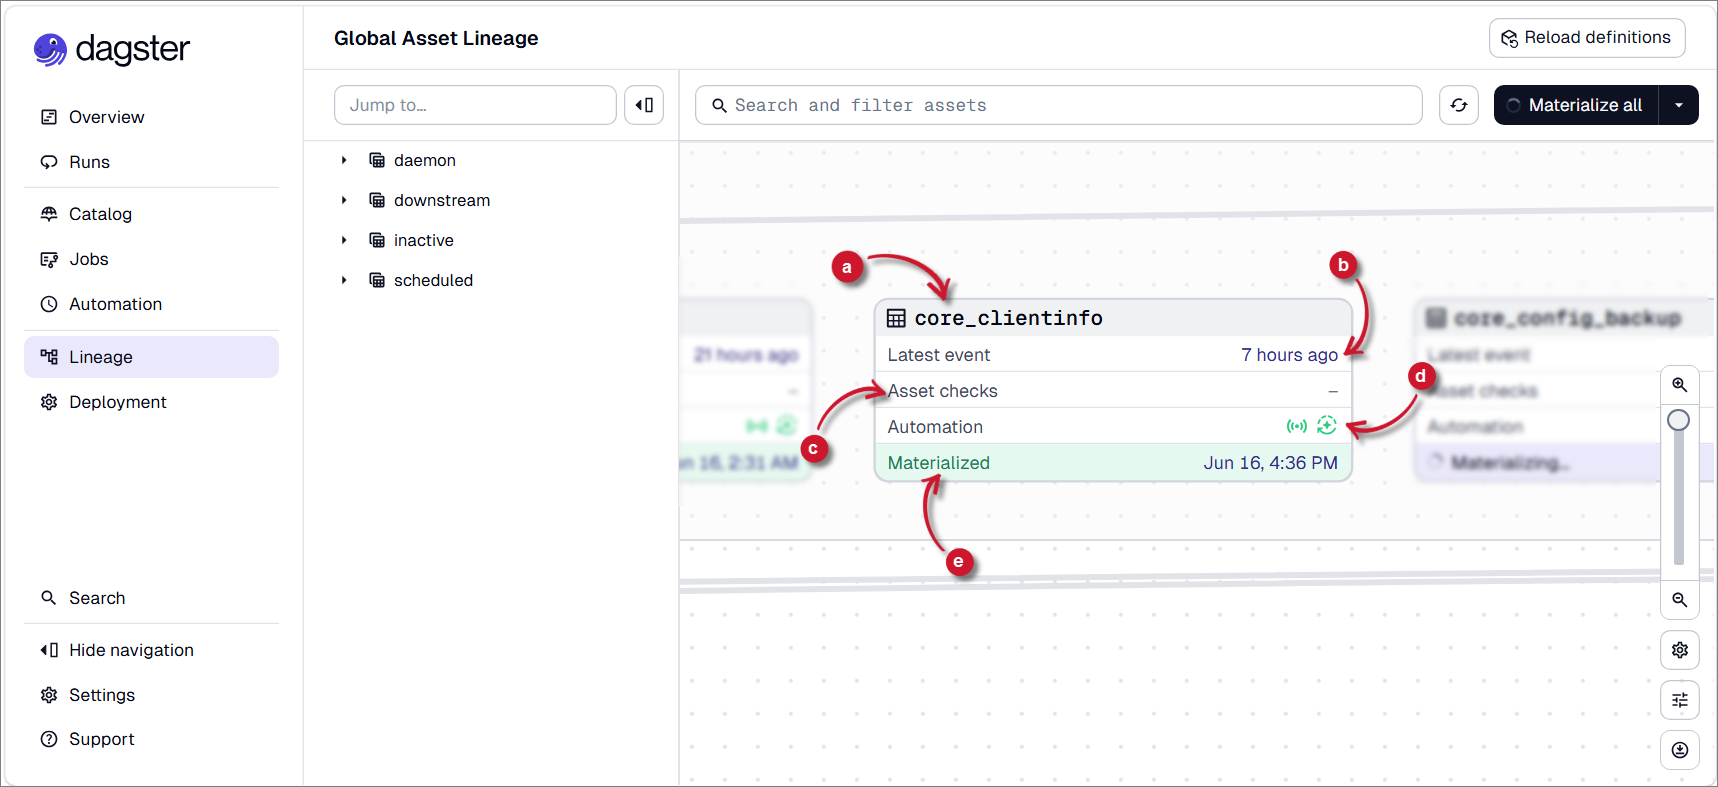 Asset Operational Details
Field Description a. Asset Name The name of the processing asset. b. Latest Event Displays the most recent execution activity for the asset. Verify that the timestamp is recent and reflects the latest expected operation. c. Asset Checks Displays the results of health, validation, or quality checks configured for the asset. This field may be blank if: - no asset checks have been defined
- checks have not yet been executed
- if the asset does not require validation checks
d. Automation Displays the status of automations associated with the asset. Automations are rules or schedules that automatically trigger asset processing, materializations, or other workflows when specific conditions are met. Review this field to confirm that configured automations are active and operating as expected. e. Materialization Status Indicates the latest processing result of the asset. A successful status confirms that the asset was materialized and its data was generated or updated successfully. Asset Operational Details
If an asset displays a Failed status, click the asset card to review its details. Before troubleshooting the asset itself, review its upstream and downstream dependencies to determine whether the failure originated from a dependent asset or has affected other assets in the lineage graph.
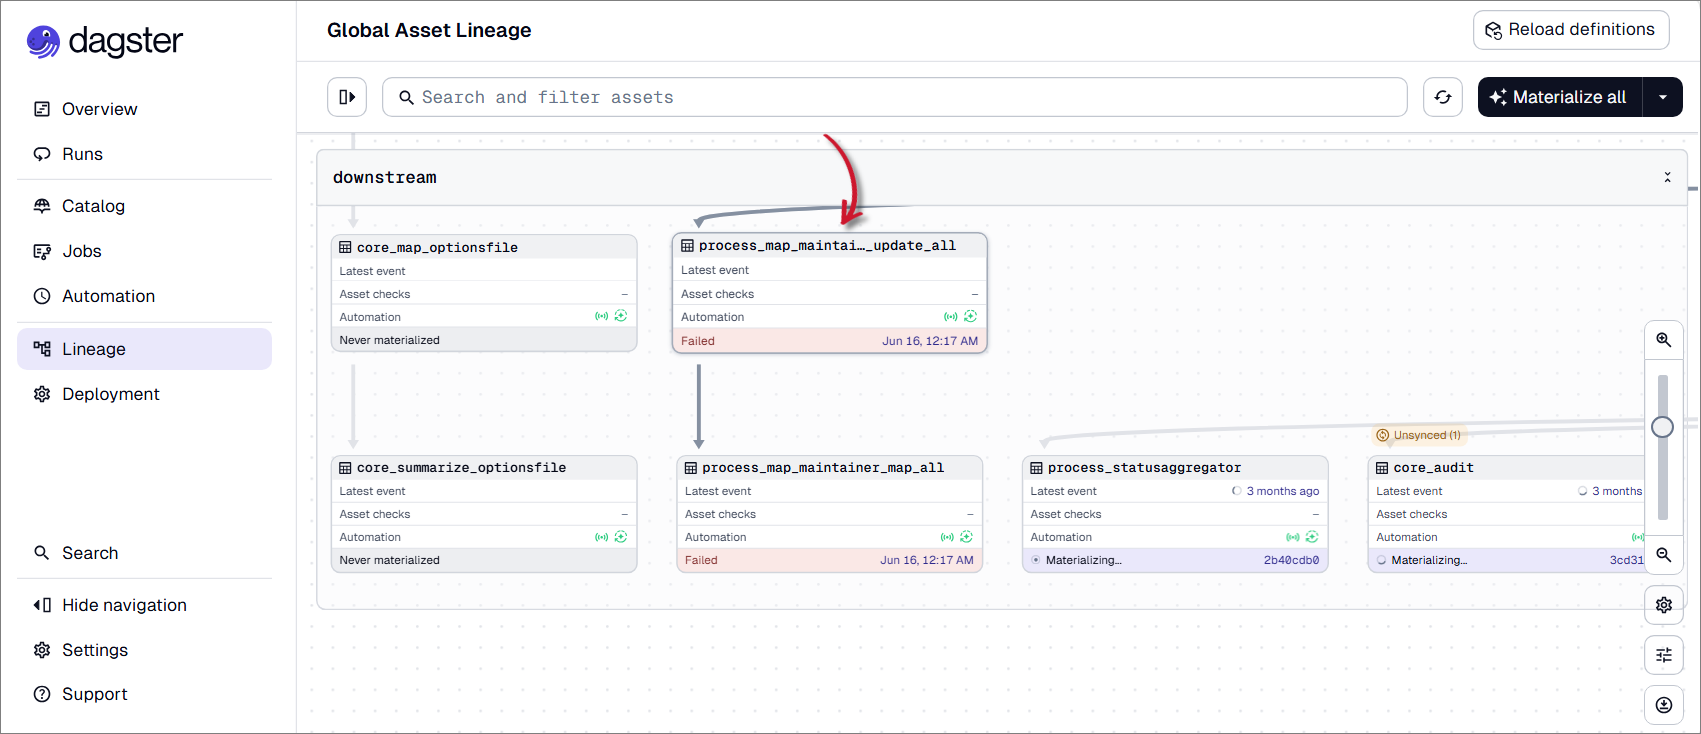 Failed Asset
To review error-related logs, scroll to the logs section and click the View logs button.
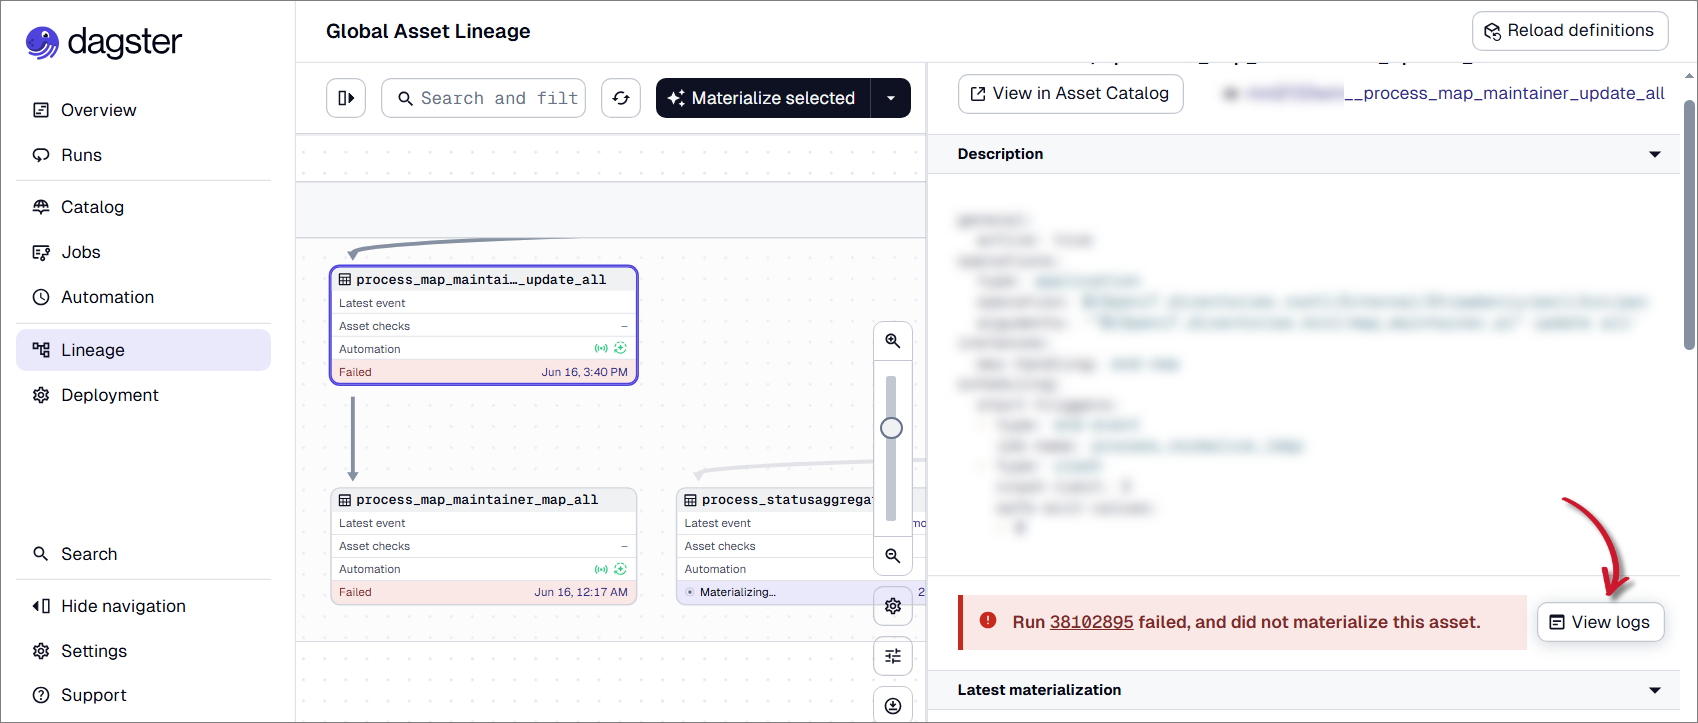 View Logs
If additional details are required, click View full message to display the complete error message and stack trace.
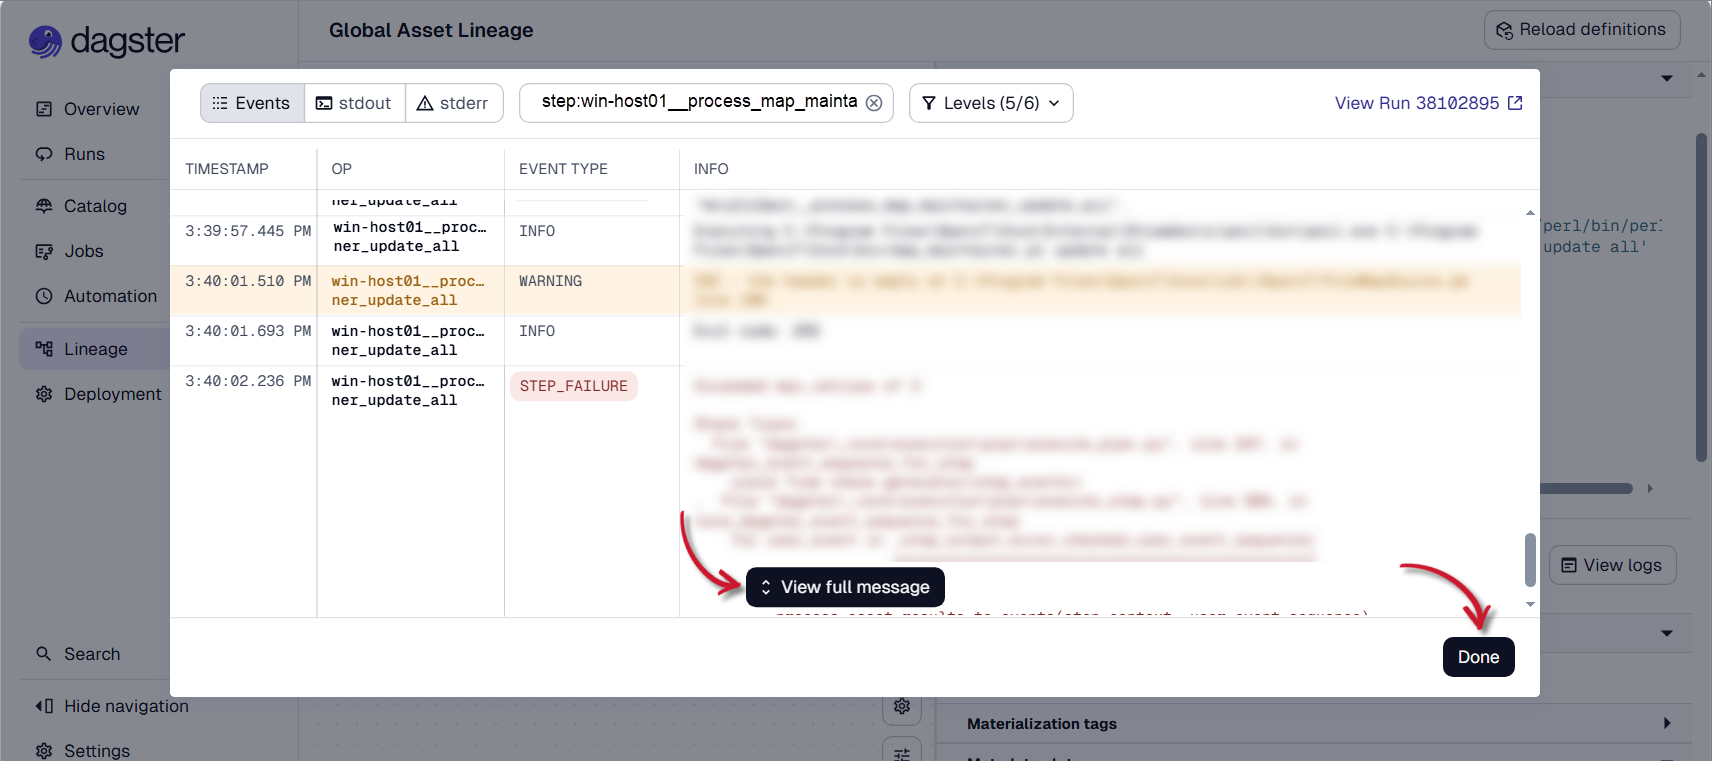 View full messageNote
If the error cannot be resolved using the available logs or troubleshooting steps, kindly reach out to the Support Team for further assistance.
After resolving the identified issue, click Materialize Selected to re-execute the asset and verify that it completes successfully.
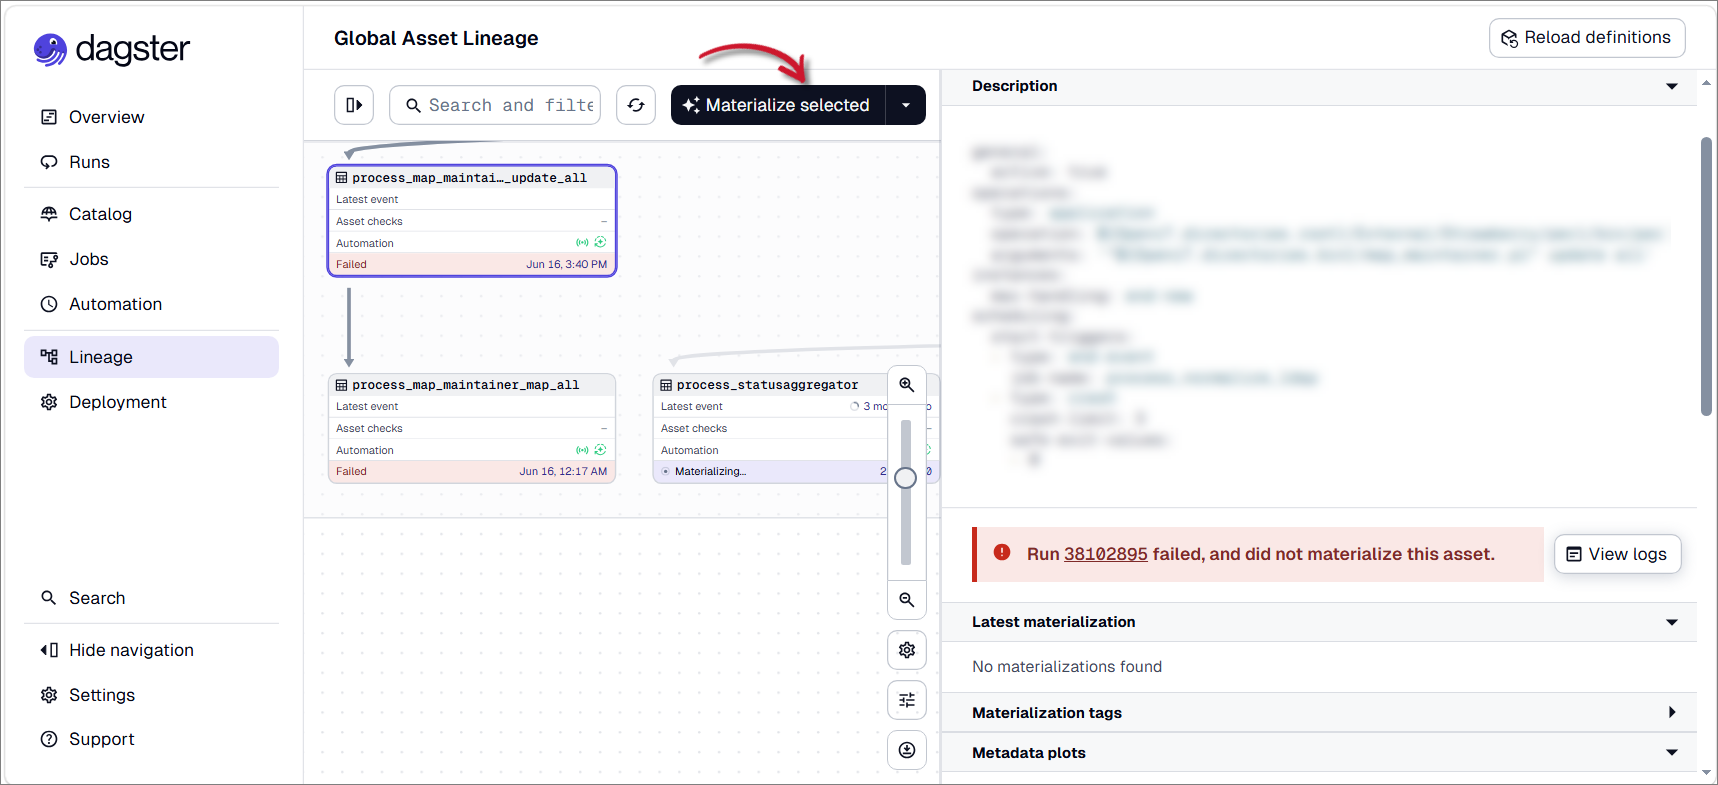 Materialize Selected Asset
 -
Monitor the materialization process and confirm that the asset completes without errors.
Checking Asset Definition and Materialization
Assets represent data, processes, or resources produced and maintained by Open iT components. The Catalog page displays Core Server assets and their details including materializations status.
To check the definition and materialization status of assets:
-
Access the Core Server web interface.
-
Once the web interface is loaded, click the menu icon located at the top part of the page. Click Data Processing GUI from the dropdown menu.
Click Data Processing GUI -
Select Catalog in the left navigation pane.
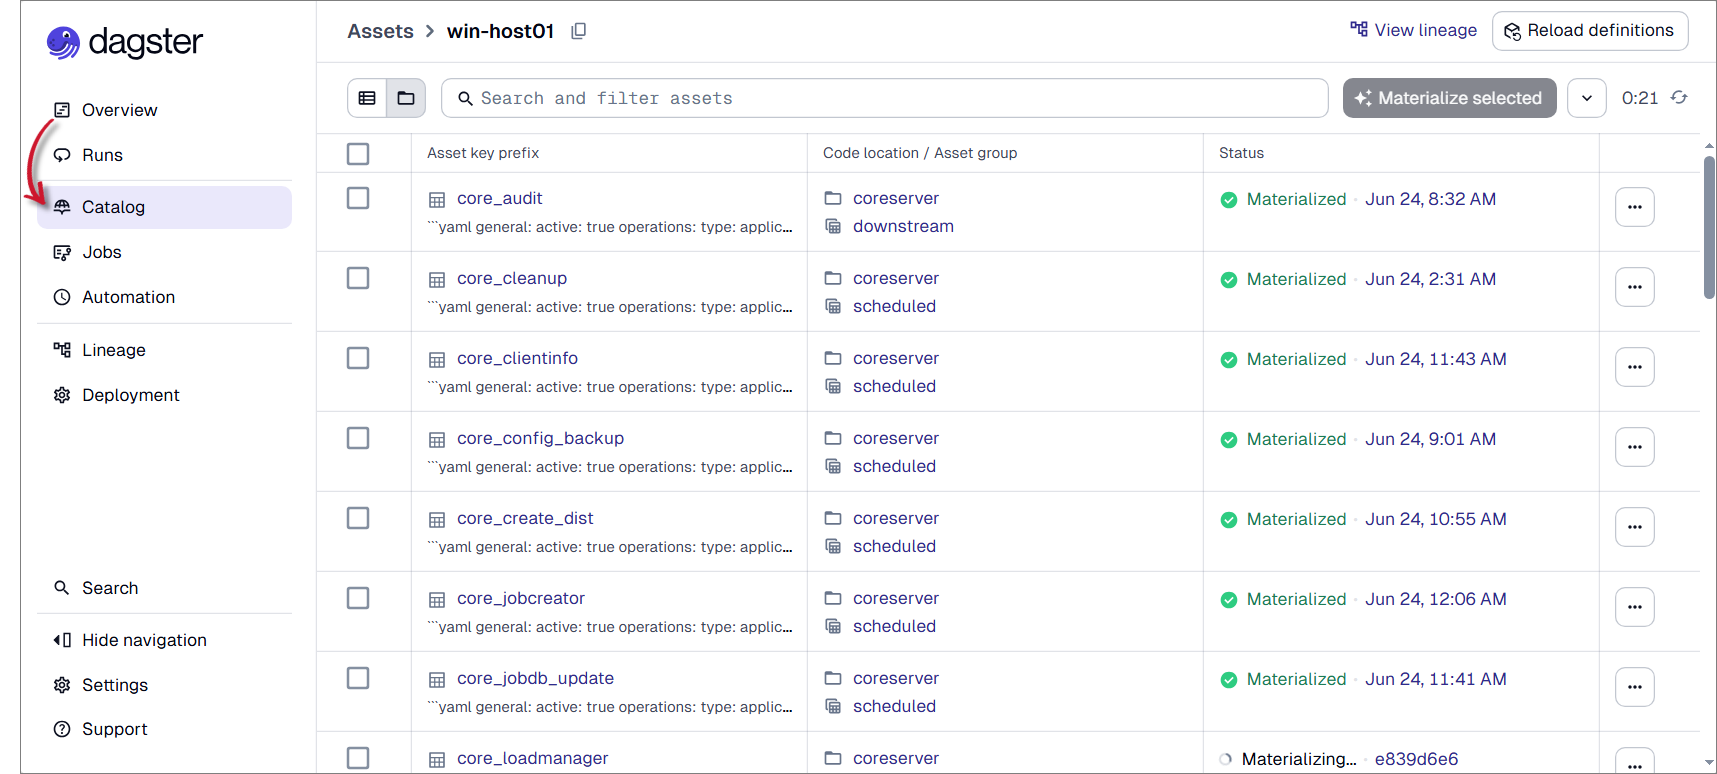 Select Catalog
 -
You can use the search and filter assets field located at the upper-part of the Catalog page to display the specific asset/s you want to review.
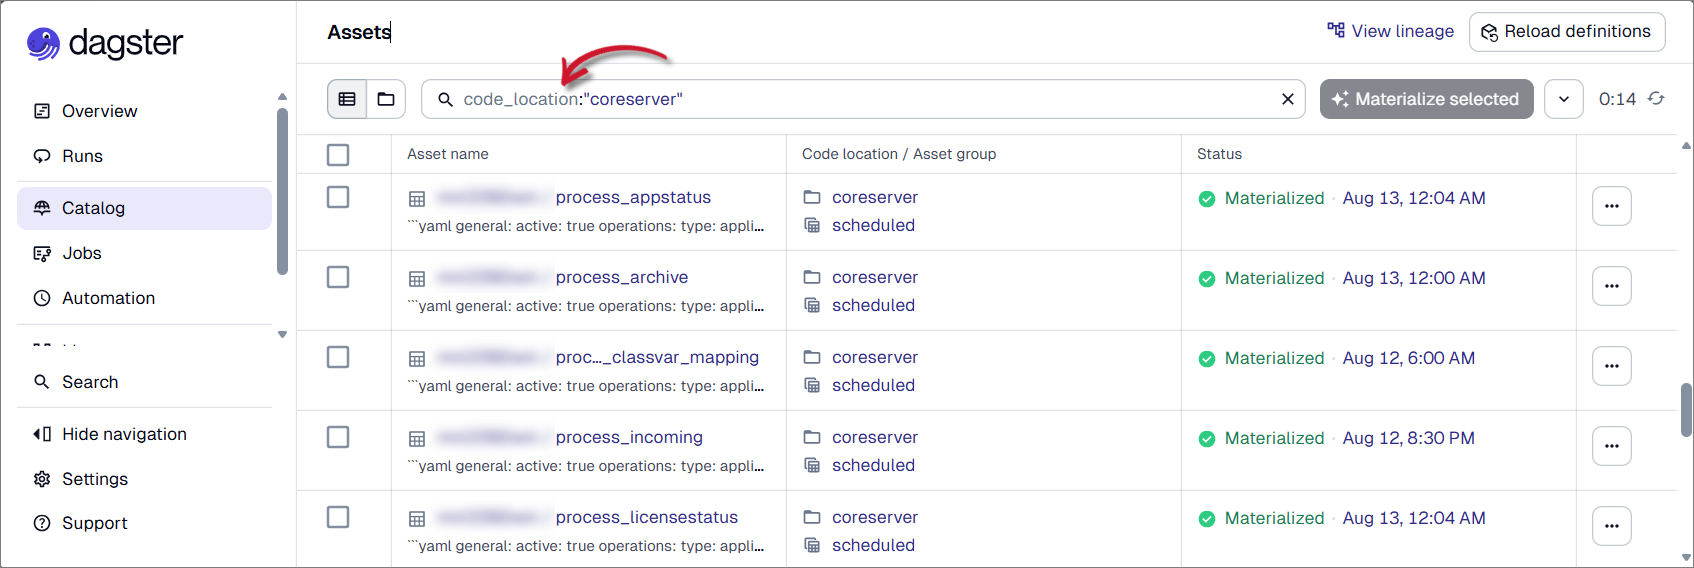 Filter Core Server Assets
 -
Check that the assets have definitions loaded from Code location / Asset group column and that no assets appear as undefined or unresolved placeholders.
-
Check that the assets are materialized successfully by checking the Status column.