OpeniT LicenseAnalyzer
The OpeniT LicenseAnalyzer dashboards provide insights into software spend, license usage, and feature utilization. They help identify savings opportunities, track consumption trends, and support license optimization through interactive charts and drill-down reports.
To access the dashboards, go to Workspaces > OpeniT LicenseAnalyzer.
Product Overview Dashboard
The Product Overview Dashboard provides visibility into product license usage, cost, and optimization opportunities. It consolidates insights into spend, utilization, and user activity to support data-driven decisions.
To access the dashboard, go to Workspaces > OpeniT LicenseAnalyzer then click the icon from the left navigation bar.
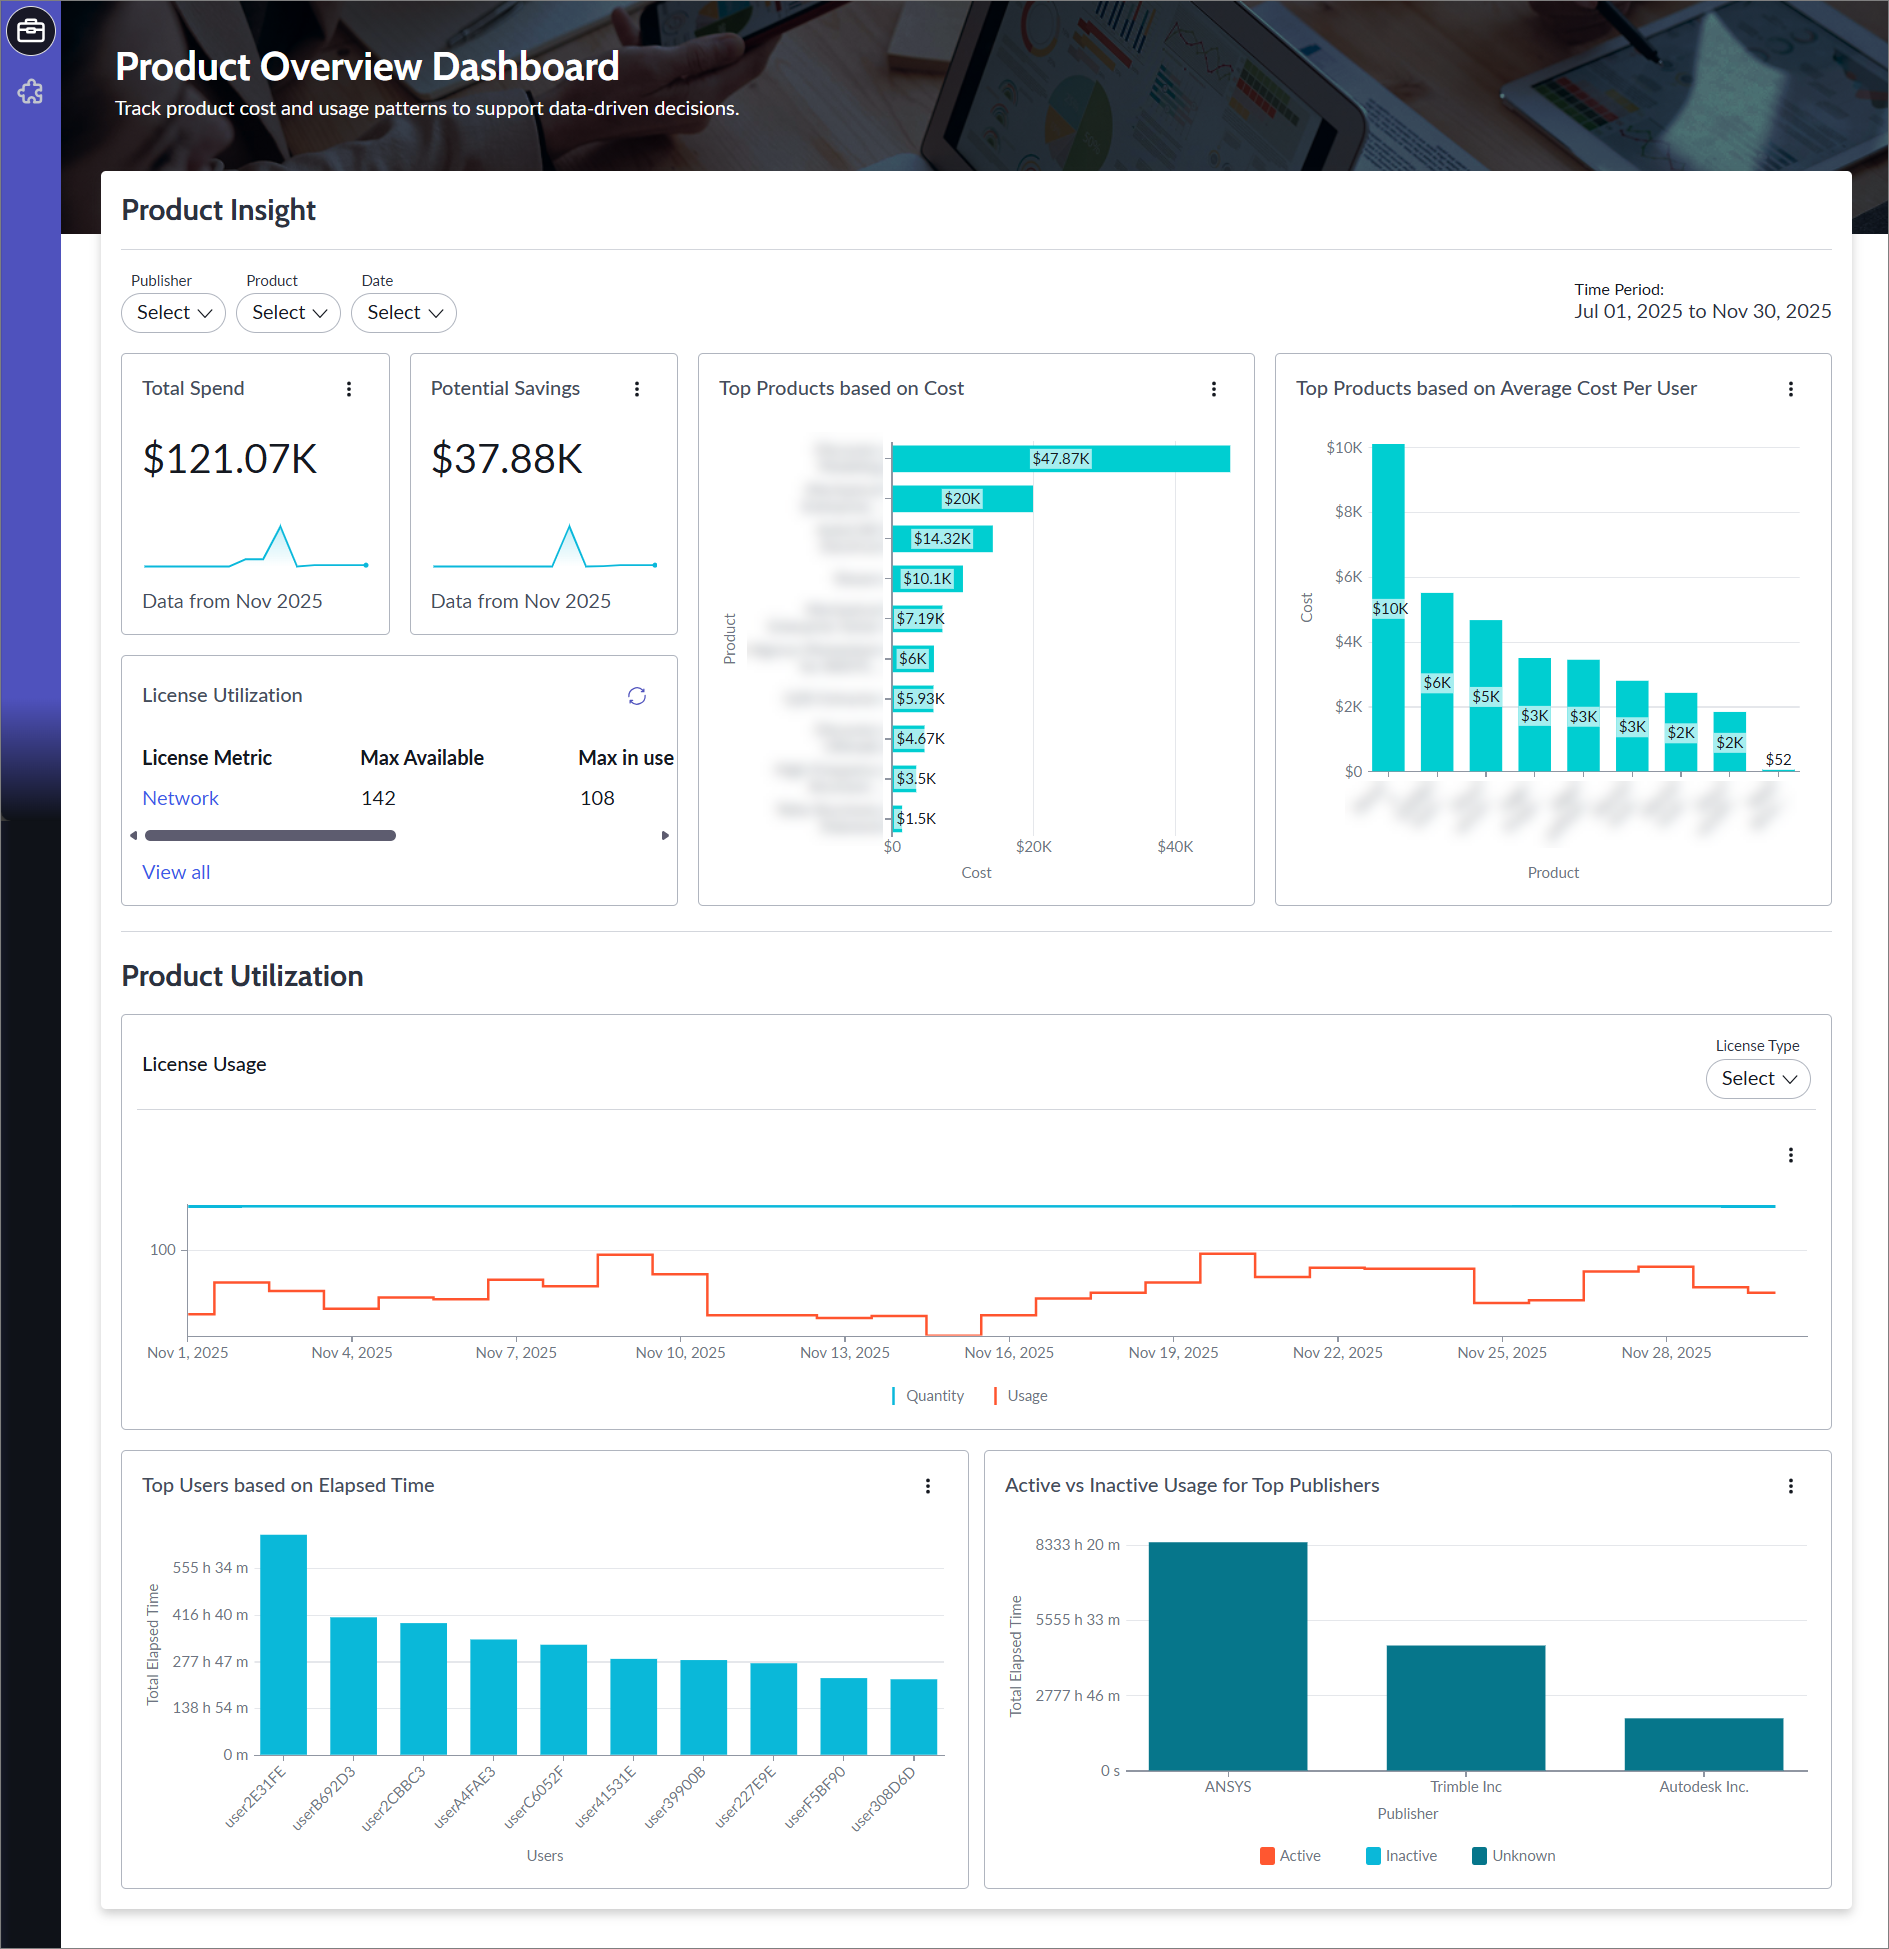
| Report | Description |
|---|---|
| Total Spend | Displays the sum of all active entitlements, shown for the month with the highest max in use in the selected date range |
| Potential Savings | Calculates the cost of unused licenses (based on the highest max in use per month), shown for the month with the highest usage in the selected date range |
| Top Products based on Cost | Shows products ranked by cost using entitlement data from ServiceNow |
| Top Products based on Average Cost per User | Shows products ranked by average cost calculated by dividing the total cost by the number of distinct users |
| License Utilization | Shows available versus used licenses with totals for spend and potential savings |
| License Usage | Displays license consumption trends over time, with separate views for concurrent and named users |
| Top Users based on Elapsed Time | Highlights users with the highest usage duration |
| Active vs Inactive Usage for Top Publisher | Displays a comparison of active and inactive usage time per publisher |
Filtering Options
You can refine the data shown in the dashboard by using the global filters available in the header:
- Publisher
- Product
- Date
The Publisher and Product filters support multiple selections, allowing you to narrow the dashboard to one or more specific products or publishers. The Date filter allows you to specify the time range for the data that appears across all reports and charts.
Bar and line graphs are interactive, allowing you to click on a bar or point to open a new page with a detailed table of the corresponding records.
Using Global Filters with Multiple Selection
Some global filters support selecting multiple values.
-
Click the filter name. This will open a selection pane.
-
Choose the values.
- Under Available, select one or more items.
- Click > to move them into the To be applied section.
-
Click Apply to confirm and apply the selections.
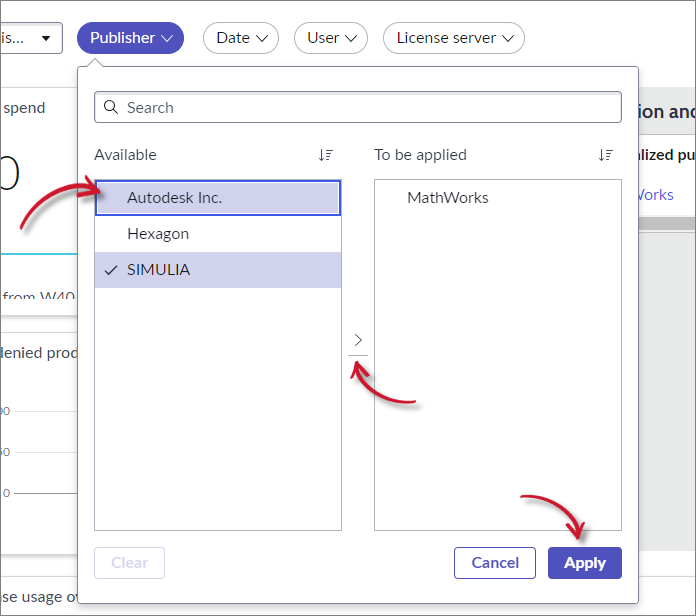
The dashboard will automatically refresh based on the selection.
Feature Overview Dashboard
The Feature Overview Dashboard provides detailed insights into feature utilization, efficiency, and license demand. It helps track which features are most used, when they are accessed, and where license shortages may occur.
To access the dashboard, go to Workspaces > OpeniT LicenseAnalyzer then click the icon from the left navigation bar.
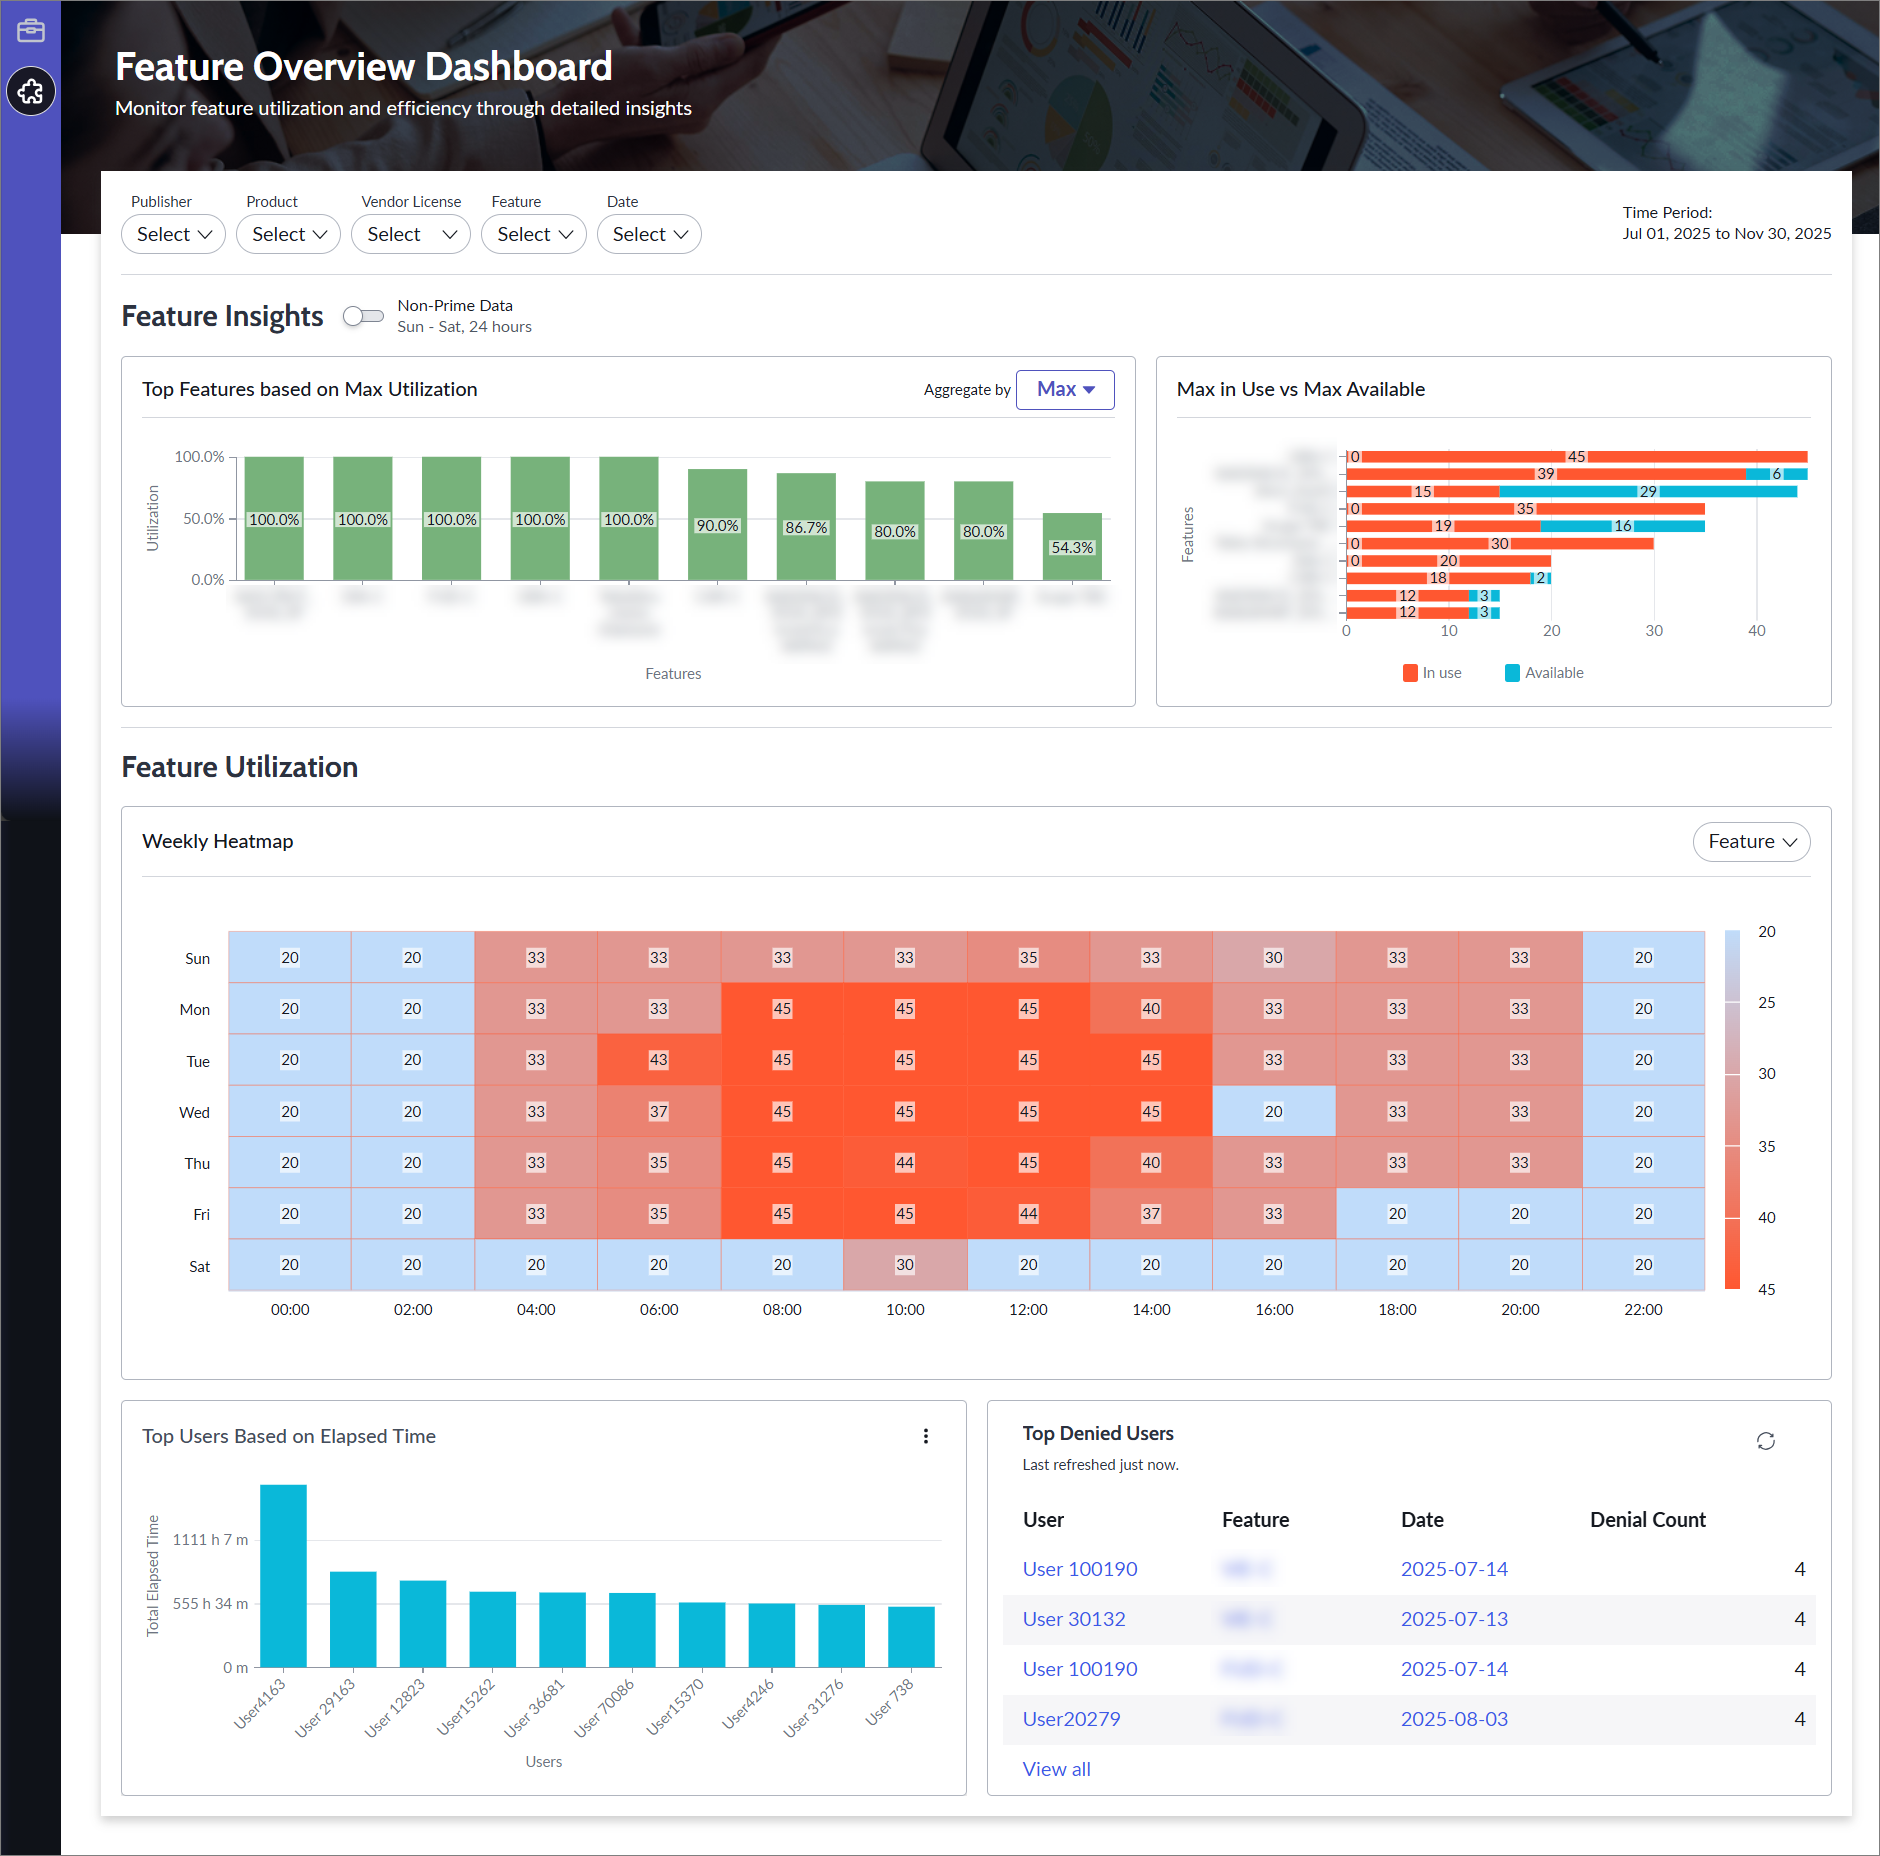
| Report | Description |
|---|---|
| Top Features based on Max Utilization | Displays the most-used features, which can be aggregated by maximum or average utilization |
| Max in Use vs Max Available | Compares the peak number of licenses used against the maximum available for each feature, highlighting unused capacity |
| Weekly Heatmap | Displays usage trends by day of the week and time of day (in 2-hour intervals), with a dedicated Feature filter to allow more granular analysis |
| Top Users based on Elapsed Time | Shows users with the highest usage time at the feature level |
| Top Denied Users | Lists users who were denied access to a feature most frequently |
Filtering Options
You can refine the data shown in the dashboard by using the global filters available in the header:
- Publisher
- Product
- Vendor License
- Feature
- Date
- Prime/Non-Prime Toggle
The Publisher, Product, Vendor License, and Feature filters all support multiple selections, enabling you to focus on specific combinations of products and features. The Date filter allows you to set the time range for the data displayed across the dashboard. In addition, there is a Prime/Non-Prime toggle filter, which allows you to switch between data views.
Bar and line graphs are interactive, allowing you to click on a bar or point to open a new page with a detailed table of the corresponding records.
Using Global Filters with Multiple Selection
Some global filters support selecting multiple values.
-
Click the filter name. This will open a selection pane.
-
Choose the values.
- Under Available, select one or more items.
- Click > to move them into the To be applied section.
-
Click Apply to confirm and apply the selections.
The dashboard will automatically refresh based on the selection.