Engineering License Overview
ServiceNow provides an Engineering License Overview dashboard for engineering applications. It gives insights into license position and usage for your engineering applications.
To access the dashboard, go to Software Asset > Software Asset Workspace > Software Asset Analytics > Engineering License Overview.
See the official ServiceNow documentation on the Engineering License Overview dashboard to learn more.
Only products and publishers classified as engineering applications and listed in the Engineering Application License (samp_eng_app_license) table appear in the filter.
The dashboard includes the following reports and charts:
| Report | Description |
|---|---|
| Total spend | Total cost of all entitlements for all products |
| Potential savings | Cost saved if removal candidates are reclaimed |
| Top denied products | Top products denied to users due to peak concurrent usage |
| Utilization and user ratio | Ratio of license utilization for normalized products and publishers to the number of users using those licenses
|
| License usage over time | Quantity of all available licenses (active and inactive products)
|
| User session summary | Duration of time users spend (idle versus active) on products
|
| Top denied users | Users most frequently denied licenses to products |
Only Active is supported in the User session summary metric.
Dashboard Controls and Actions
Filtering Options
The dashboard supports the following global filters, which apply across all reports and charts:
- Main filter – choose either Publisher or Product.
- Publisher
- Product
- Date
- User
- License server
Using Global Filters with Multiple Selection
Some global filters support selecting multiple values.
-
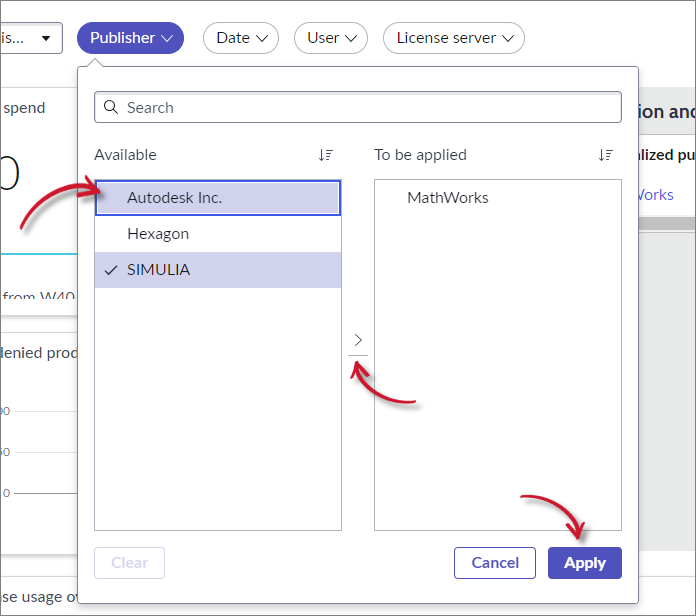
Click the filter name. This will open a selection pane.
-
Choose the values.
- Under Available, select one or more items.
- Click > to move them into the To be applied section.
-
Click Apply to confirm and apply the selections.
The dashboard will automatically refresh based on the selection.
If no product or publisher is selected, the dashboard shows cumulative data for all engineering applications.