Reports
Reports allows users to generate predefined reports directly from Core Server flat data files without requiring an Analysis Server installation. This eliminates the need to load large amounts of data into the SQL database, helping improve reporting efficiency and reduce potential delays.
Each report includes a set of filters that allows users to customize the results based on their reporting requirements. Generated reports can be downloaded in CSV format for tabular reports or PNG format for graphical reports. Additionally, the Export to Excel feature allows users to export the complete report as a single Excel file.
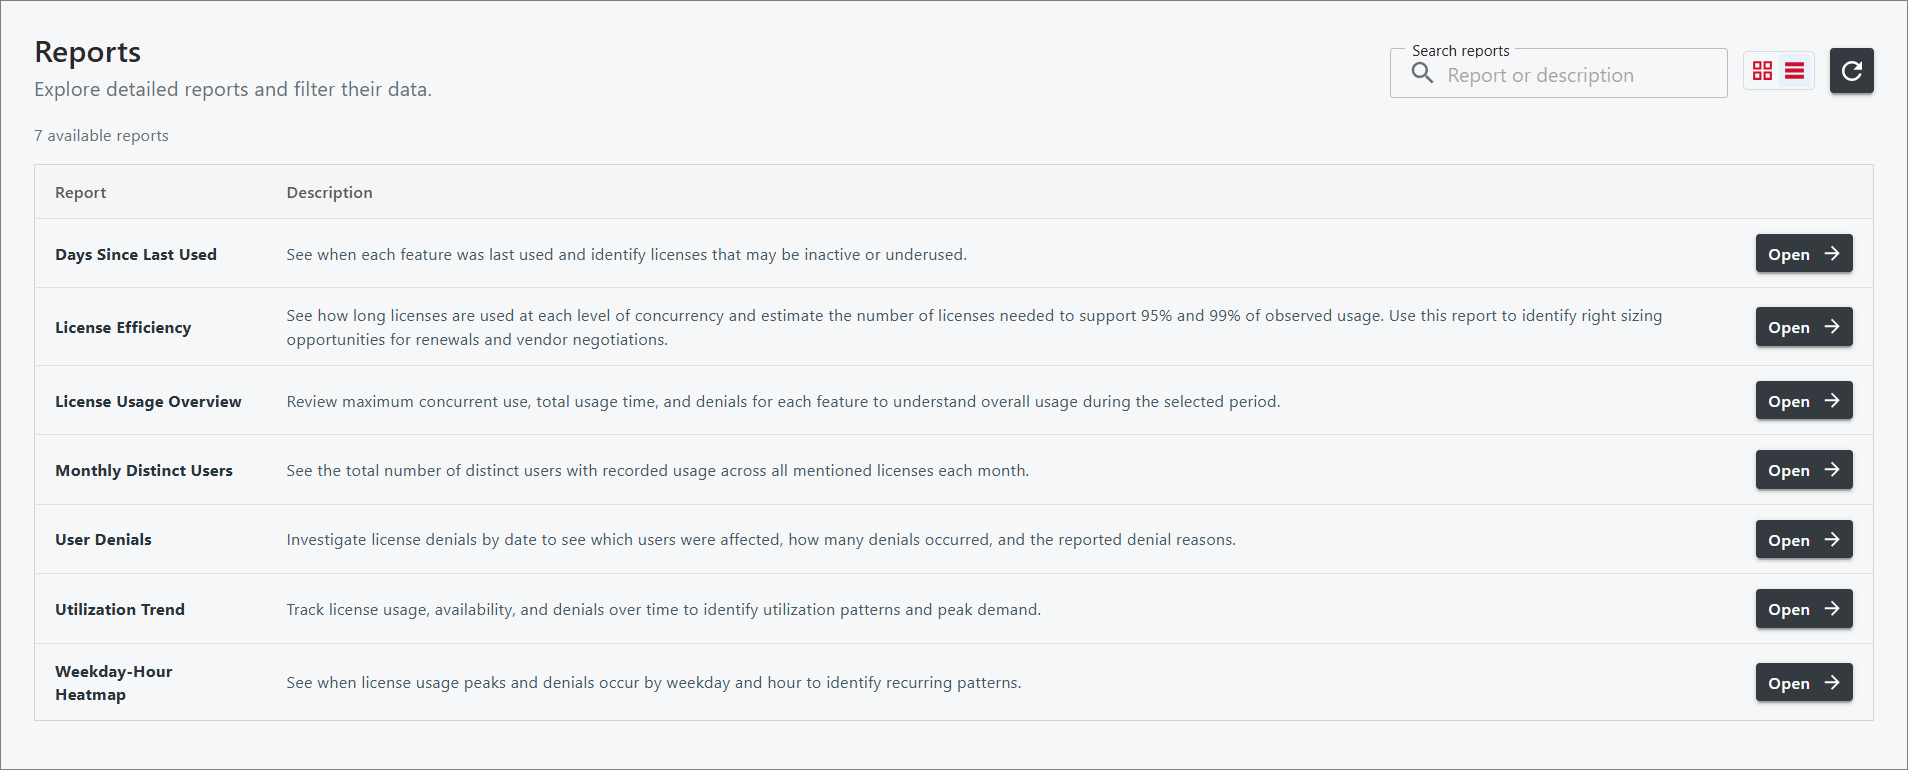
The following table lists the available reports and their descriptions.
| Report Title | Description |
|---|---|
| Days Since Last Used | Displays the number of days since each feature was last used, helping identify inactive or underutilized licenses. |
| License Efficiency | Displays the duration of license usage at different concurrency levels and estimates the number of licenses required to accommodate 95% and 99% of observed usage. This information helps identify opportunities for license optimization and renewal planning. |
| License Usage Overview | Provides an overview of license usage for each feature, including maximum concurrent usage, total usage duration, and license denials within the selected period. |
| Monthly Distinct Users | Displays the total number of unique users with recorded license usage for each month across the included licenses. |
| User Denials | Provides details of license denials by date, including affected users, the number of denials, and the reported reasons for each denial. |
| Utilization Trend | Displays license usage, availability, and denials over time, helping identify utilization trends and periods of peak demand. |
| Weekday-Hour Heatmap | Displays license usage peaks and denials by day of the week and hour, helping identify recurring usage patterns. |
Requirements
Before generating reports, make sure that the following data types are available in the database folder:
- (75) License Logfile Events
- (89) Total License Use Licenseevents
- (90) Individual License Use Licenseevents
- (94) OLAP User Concurrency
- (102) OLAP Total Use
- (104) License Logfile Events v2.0
Accessing the Reports Page
To access the Reports page:
-
Log in to the Core Server.
-
Click the app menu icon in the upper-right corner of the page, next to the account menu.
-
Select Reports.
The Reports page will open, displaying the available reports.
Navigating the Reports Page
The Reports page provides options for searching, refreshing, and changing how the available reports are displayed. These options are located in the upper-right corner of the page.
Searching and Refreshing Reports
-
Use the Search Reports field to find reports by name or description.
-
Click the refresh icon to update the list of available reports.
Changing Report Views
The available reports can be displayed in either grid or list view.
Grid View
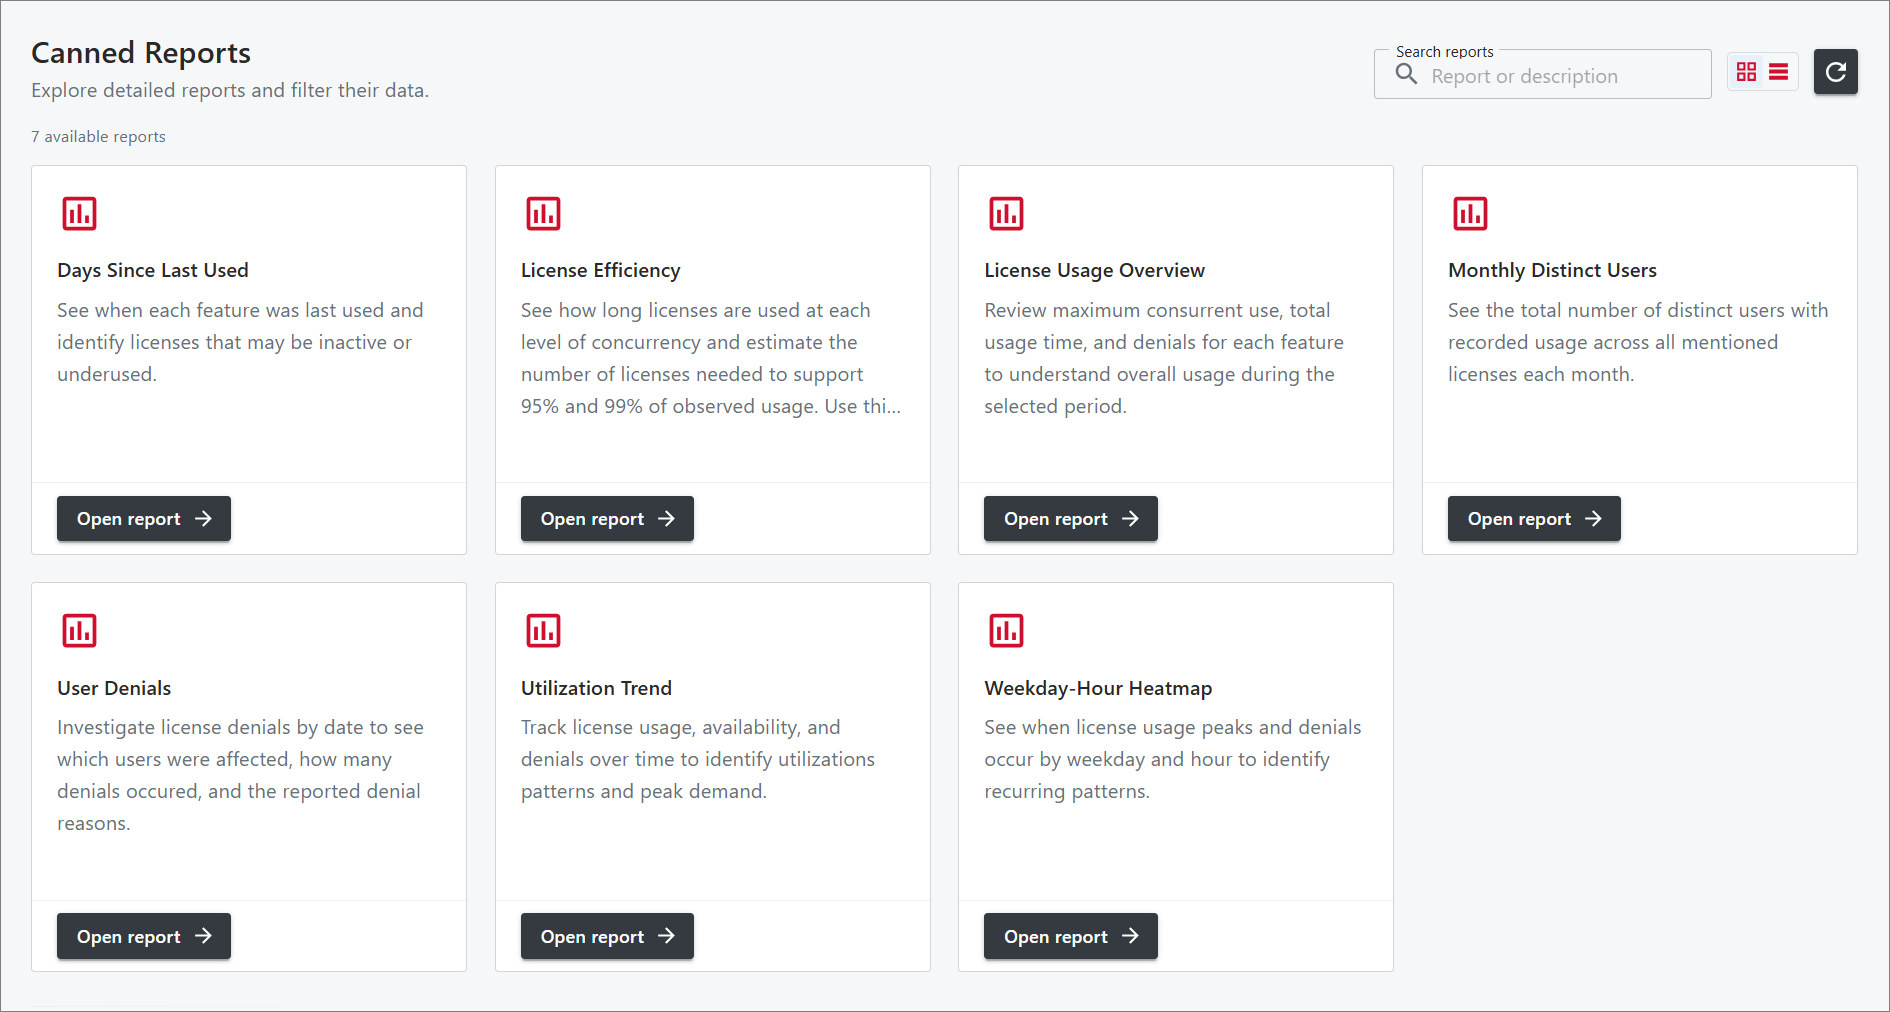
Click the grid icon to display the available reports as individual cards.
List View
Click the list icon to display the available reports in a list layout.