Installation Verification
- Windows
- Unix
Verifying the Running Open iT Processes
-
Open the Task Manager.
-
Click Services.
-
Verify that the listed service or services are running.
Service Purpose OpeniTRegistrar Maintains the Core Server connection and service registration with Open iT Ingress. OpeniTReporting Provides the Core Server reporting web interface and access to generated reports. OpeniTCoreAPI Hosts the Core Server API used for file uploads, forwarding, health checks, and other component integrations.
Introduced in version 10.2.570OpeniTServer Runs the main Core Server background operations that receive and process data from Open iT Clients. OpeniTCoreServerPipeline Hosts the Core Server data-processing definitions and logic used by the Orchestrator. OpeniTOrchestratorDaemon Runs the background orchestration processes that evaluate schedules and sensors, coordinate runs, and submit work for execution. OpeniTOrchestratorWebserver Provides the Orchestrator web interface and API. Core Server Services
For more information about the purpose and functions of these services, see Open iT Services.
Verifying the Created Directories
Go to the Core directory, which is by default in C:\Program Files\OpeniT\Core, and verify that the following directories exist:
-
bin (
<bin_dir>) - contains binary files -
Configuration (
<config_dir>) - contains Core Server configurations -
contrib - contains scripts used by Open iT
-
External - contains external resources needed by the Core Server, such as the Apache, Git OpeniTDiscoveryTool, PHP, PostgreSQL, and Strawberry Perl binaries
-
images - contains images used by the Core Reporter
-
lib - contains the Perl library files used by Open iT
-
libexec - contains applications packaged in separate directories with their own runtime environments
-
Log (
<debug_dir>) - contains troubleshooting logs created by the Open iT binarieswarningThis directory and its contents are sent to the Open iT Support Team at support@openit.com whenever an issue occurs. Make sure to set debug logging to 0 after doing so to prevent too much space consumption.
-
ReportingServer - contains files used by the web application
-
src - contains Lua source files
Verifying the Running Open iT Processes
Go to the bin directory, which is by default in /opt/openit/bin, and run the following command:
./openit-all status
A successful installation displays something similar to the following:
 Sending Open iT Daemons: status
 openit-coreserverpipeline (pid ##### ##### ##### ##### ##### ##### ##### ##### #####) is running
 openit-orchestratorwebserver (pid ##### #####) is running...
 openit-orchestratordaemon (pid ##### #####) is running...
 openit_serverd (pid ##### #####) is running...
 openit_loggerd (pid ##### #####) is running...
 httpd (pid ##### ##### ##### ##### ##### ##### ##### #####) is running...
 openit_coreapi (pid ######) is running...
The openit_coreapi was introduced in version 10.2.570.
Alternatively, run the following command to check a specific process status:
systemctl status <process>
systemctl status openit-coreserverpipeline
Verifying the Created Directories
-
Go to the openit (
<root_temp_dir>) directory, which is by default in/var/opt/openit, and verify that it contains the following directories:- debug (
<debug_dir>) - etc (
<config_dir>) - inst
- log
- src
- temp (
<temp_dir>)
These directories contain specific configuration files, error and debug logs.
- debug (
-
Go to the openit (
<root_dir>) directory, which is by default in/opt/openit, and verify that it contains the following directories:- bin (
<bin_dir>) - classes
- config
- contrib
- db
- dotnet
- external
- html
- images
- ingress
- lib
- libexec
- modules
- smarty
- vendor
- websocket
These directories contain files for the web interface.
- bin (
-
Go to the defined data_dir (
<root_data_dir>) upon Open iT installation and verify that it contains the following directories:- admin - will contain the admin assistant data
- app_status - will contain application status data
- archives - will contain the archived data
- cbcs - will contain cbcs parquet data
- confbackupfiles - will contain confbackup archives
- dagster - will contain the Dagster event logs
- database - will contain the Open iT database
- incoming - will contain the incoming data
- license_status - will contain license status data
- periodic_reports - will contain files needed to generate periodic reports
- Portal - will contain AutodeskInsight files
- project - will contain mapping source data
- queries - will contain customer defined Canned Reports/Apps
- raw_options_file - will contain parsed options files data from clients
- results - will contain generated reports
- simpleReports - contains report templates
- streamlit - will contain customer defined Canned Reports/Apps
- temp - will contain collected client data sent to the server
-
Go to
/etc/opt/openitand verify that it contains the following:- openit.cfg
- perl
- openit.env
- php.ini
These files are used for general Open iT configuration.
Verifying Data Processing
This section helps you to verify that the Core Server environment, plugins, and data processing pipelines are functioning correctly through the Data Processing GUI (Dagster), which provides visibility into pipeline execution, logs, schedules, and processing status.
Accessing Data Processing GUI (Dagster)
-
Access the Core Server web interface.
-
Once the web interface is loaded, click the menu icon located at the top part of the page. Click Data Processing GUI from the dropdown menu.
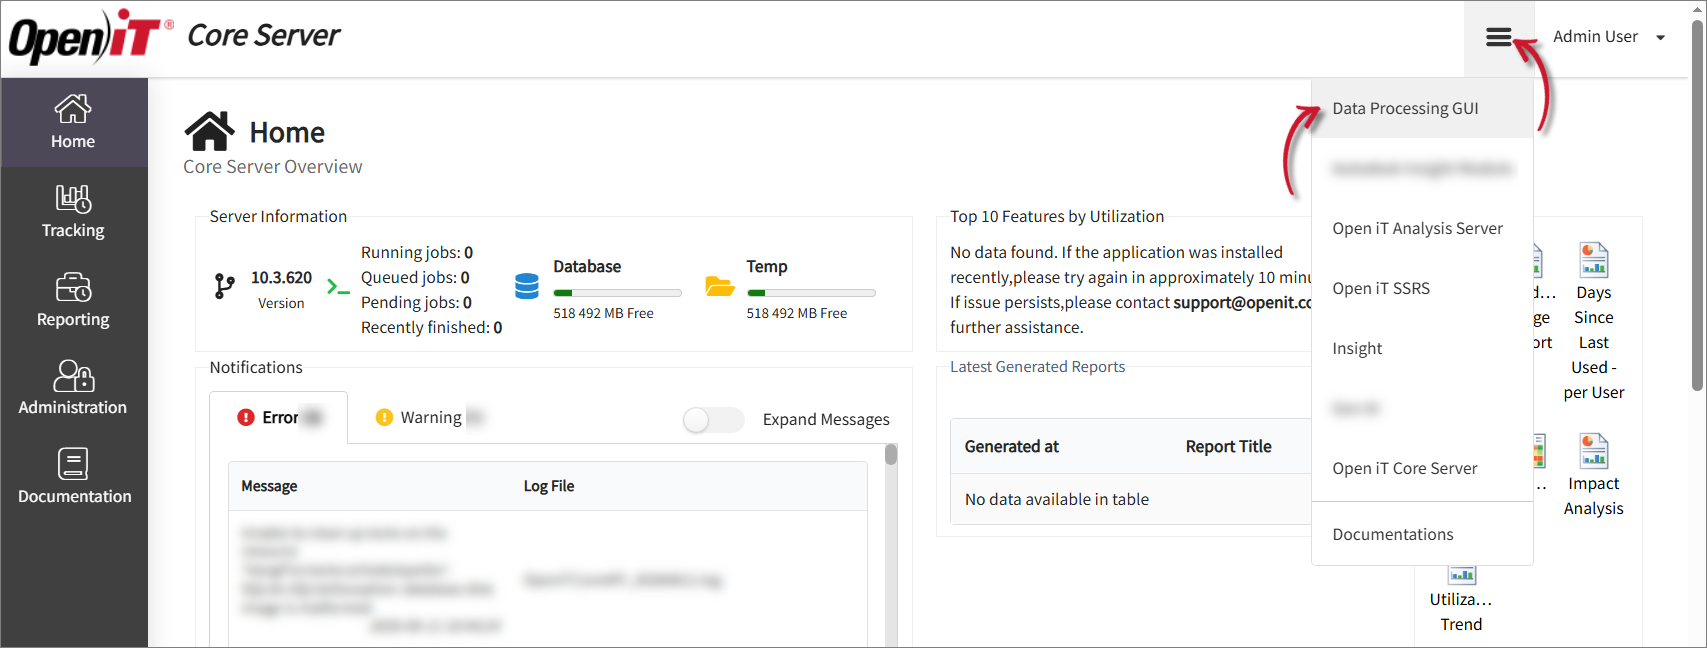 Click Data Processing GUI
Verifying Code Location Status
The Code Locations contain the definitions of the assets, jobs, schedules, sensors, and other Dagster components required by Core Server data processing workflows. A successfully loaded Core Server code location indicates that Dagster can access the workflow definitions required to perform data processing operations.
To verify the status of code locations:
-
Access the Data Processing GUI (Dagster).
-
In the left navigation pane, select Deployment.
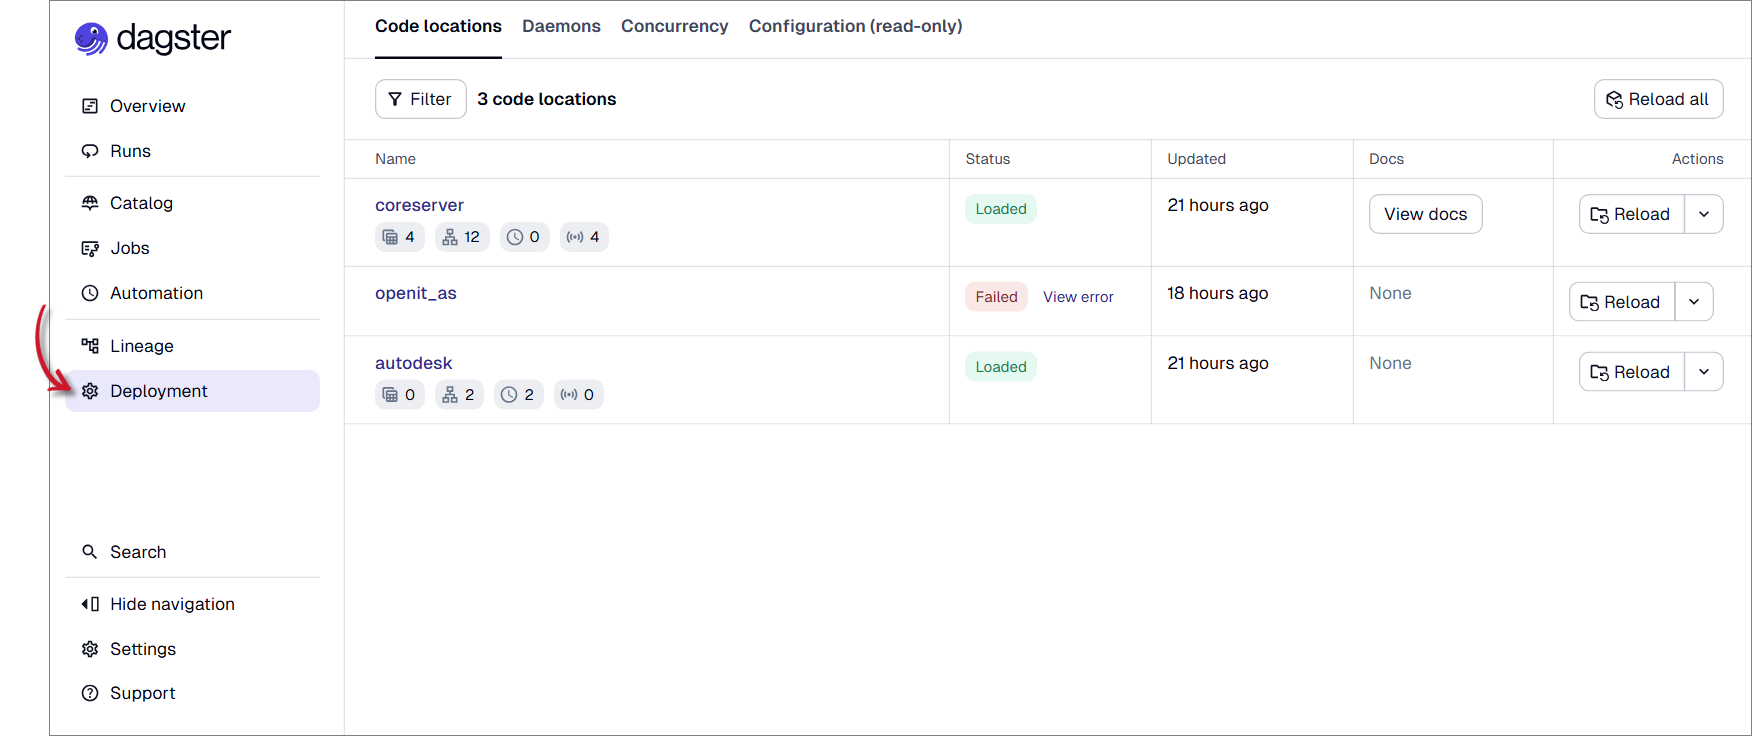 Select Deployment
The Deployment page opens and displays the configured code locations.
-
Go to the Code Locations tab located at the upper-part of the page. Verify that the coreserver code location is loaded successfully.
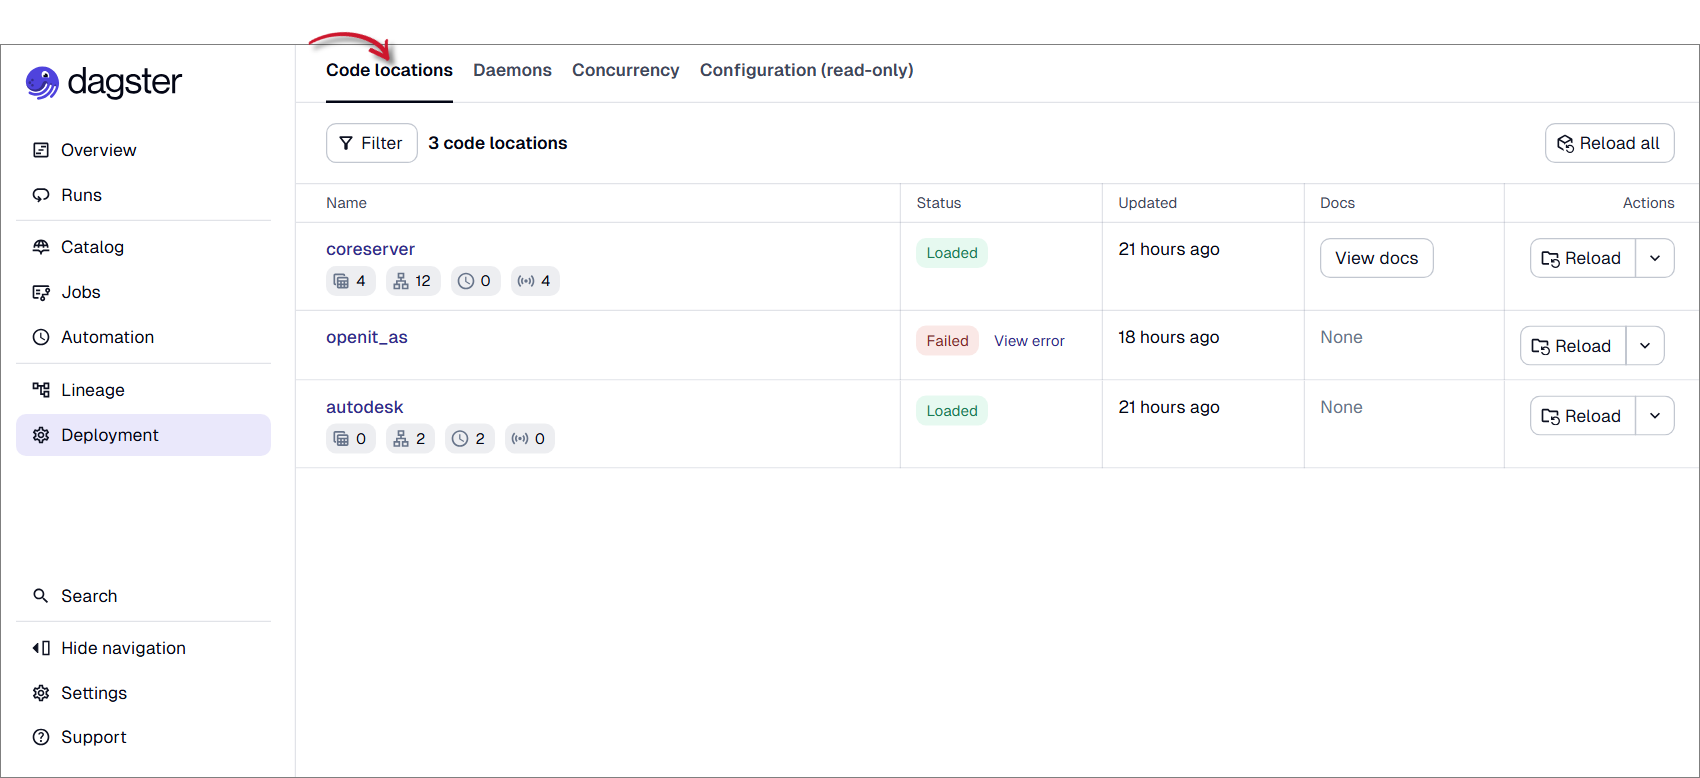 Click Code Locations
Verifying Daemon Status
Dagster daemons are background services that support the automated execution and orchestration of Core Server data processing workflows. These services evaluate schedules and sensors, coordinate backfill operations, and perform other automation tasks required by Core Server components and installed plugins.
To verify the status of daemons:
-
Access the Data Processing GUI (Dagster).
-
In the left navigation pane, select Deployment.
Select DeploymentThe Deployment page opens and displays the configured code locations.
-
Go to the Daemons tab located at the upper-part of the page, then verify that all required daemons are in the Running state.
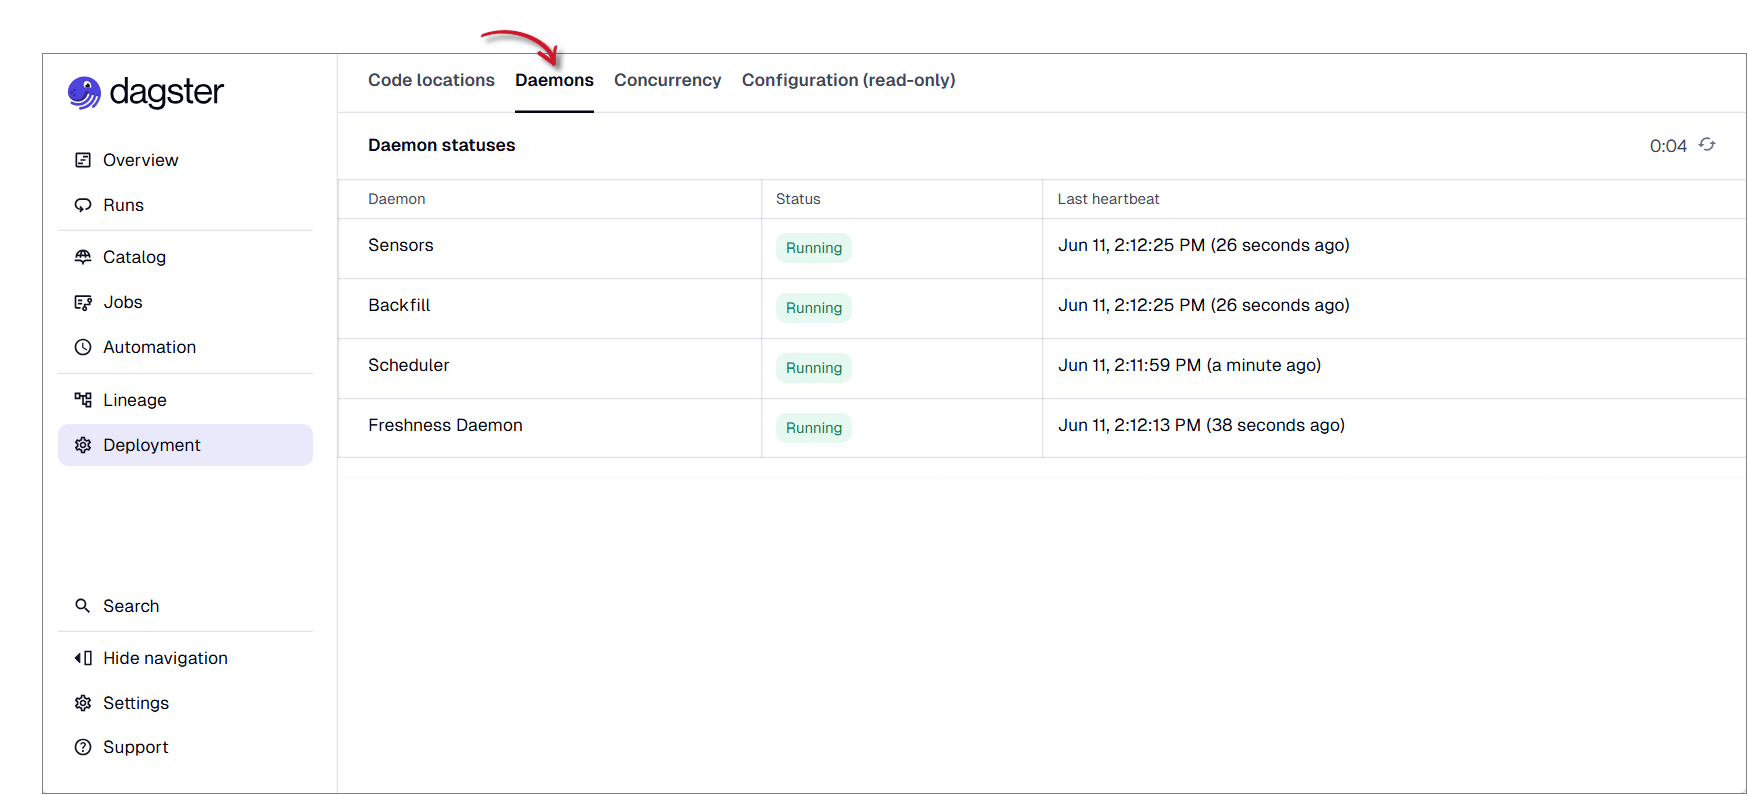 Go to Daemons
The following daemons should be present:
Daemon Description Sensor Monitors events and automatically starts workflows when predefined conditions are met. Backfill Reprocesses historical data when missing data needs to be recovered or regenerated. Scheduler Runs scheduled workflows, such as data collection and data processing. Freshness Daemon Ensures that collected and processed data remains up-to-date for reporting and analysis. Dagster Daemons
Verifying Assets Status
Assets represent data, processes, or resources produced and maintained by Open iT components. The Catalog page displays Core Server assets and their details including materializations status.
To check the status of Core Server assets:
-
Access the Data Processing GUI (Dagster).
-
Select Catalog in the left navigation pane.
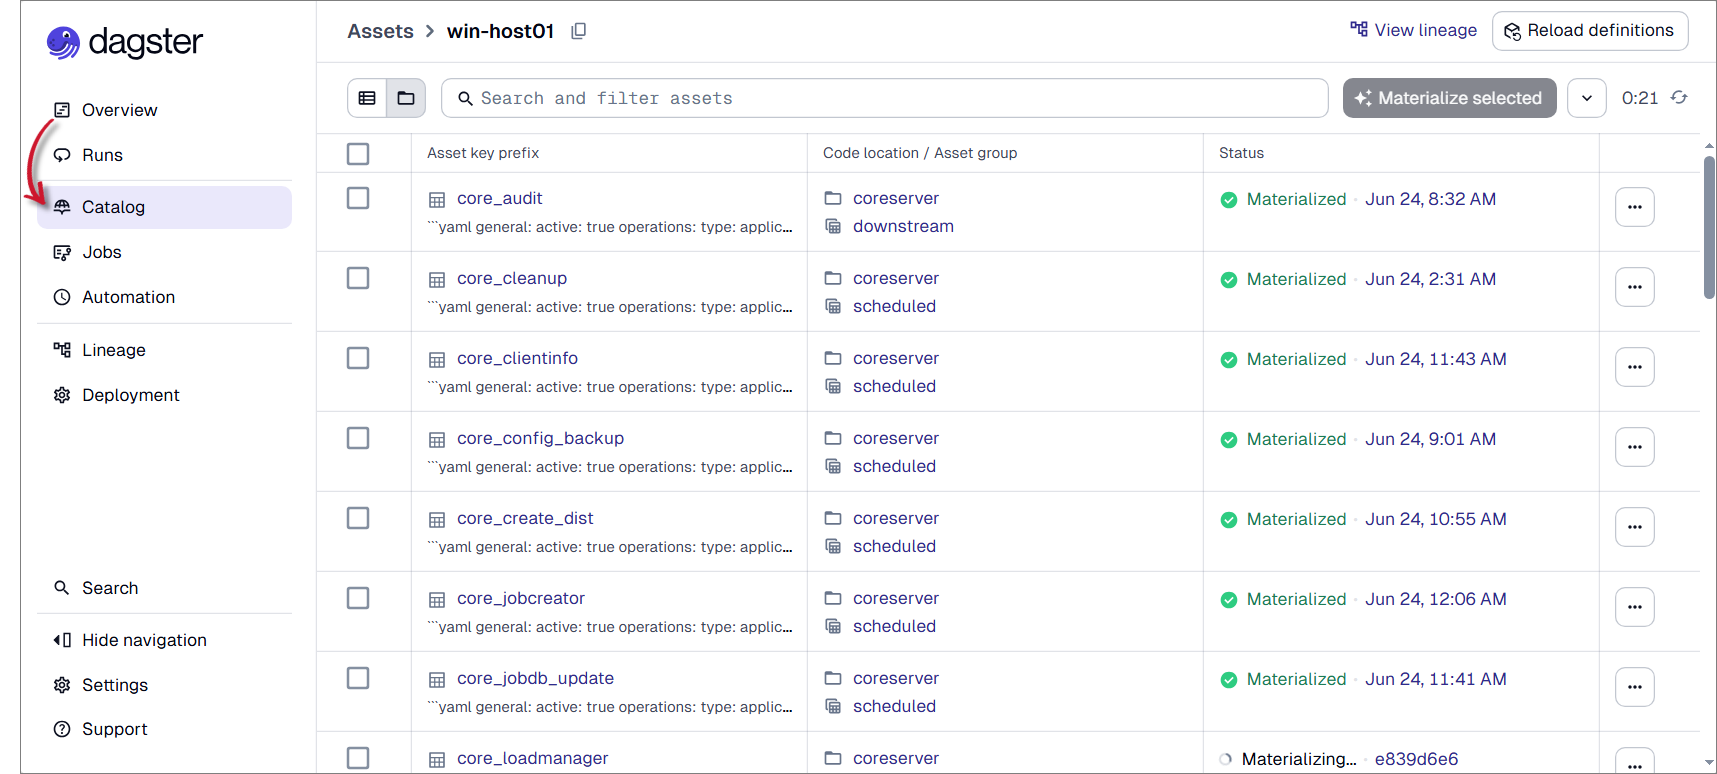 Select Catalog
 -
To display only the assets associated with Core Server, enter
code_location:"coreserver"in the search and filter assets field located at the upper-part of the Catalog page, then press Enter.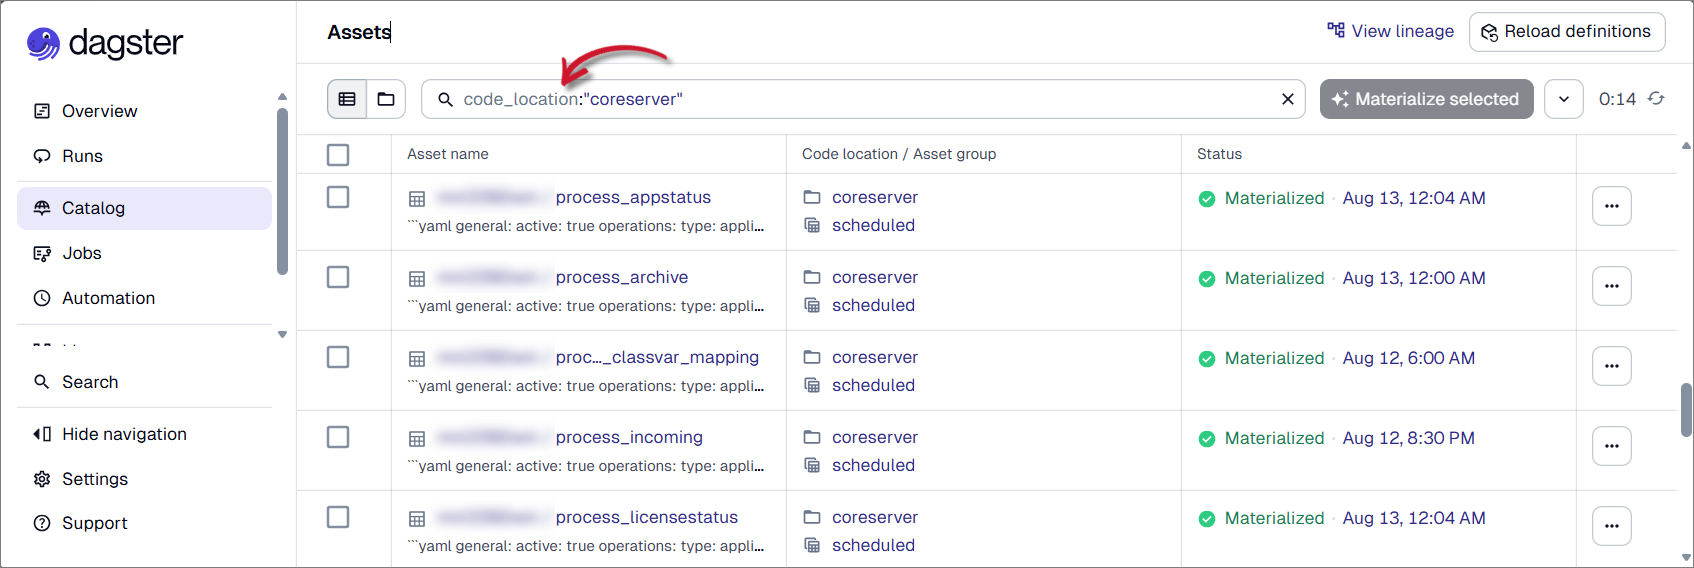 Filter Core Server Assets
 -
Verify that the Core Server assets have definitions loaded from the
coreservercode location and that no assets appear as undefined or unresolved placeholders. -
Verify that the Core Server assets are materialized successfully by checking the Status column.
Verifying Automations
The Automations view provides a timeline of automation executions across all configured code locations that are associated with Open iT components.
To check the status of automations:
-
Access the Data Processing GUI (Dagster).
-
In the left navigation pane, select Overview.
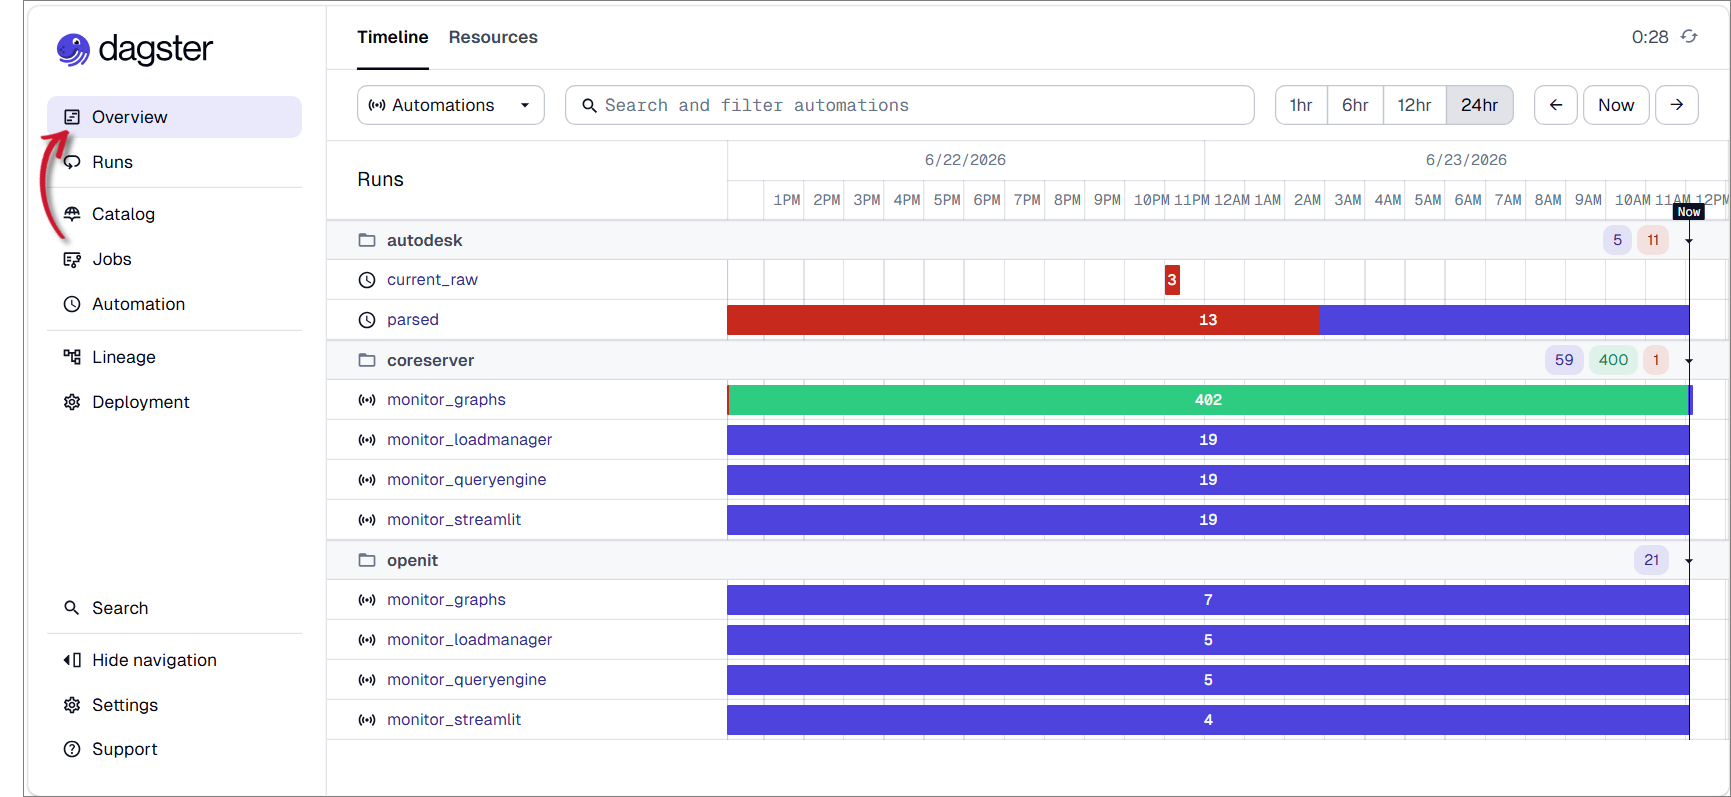 Select Overview
 -
Go to the Timeline tab, then select Automations from the dropdown menu located at the upper-left part of the page.
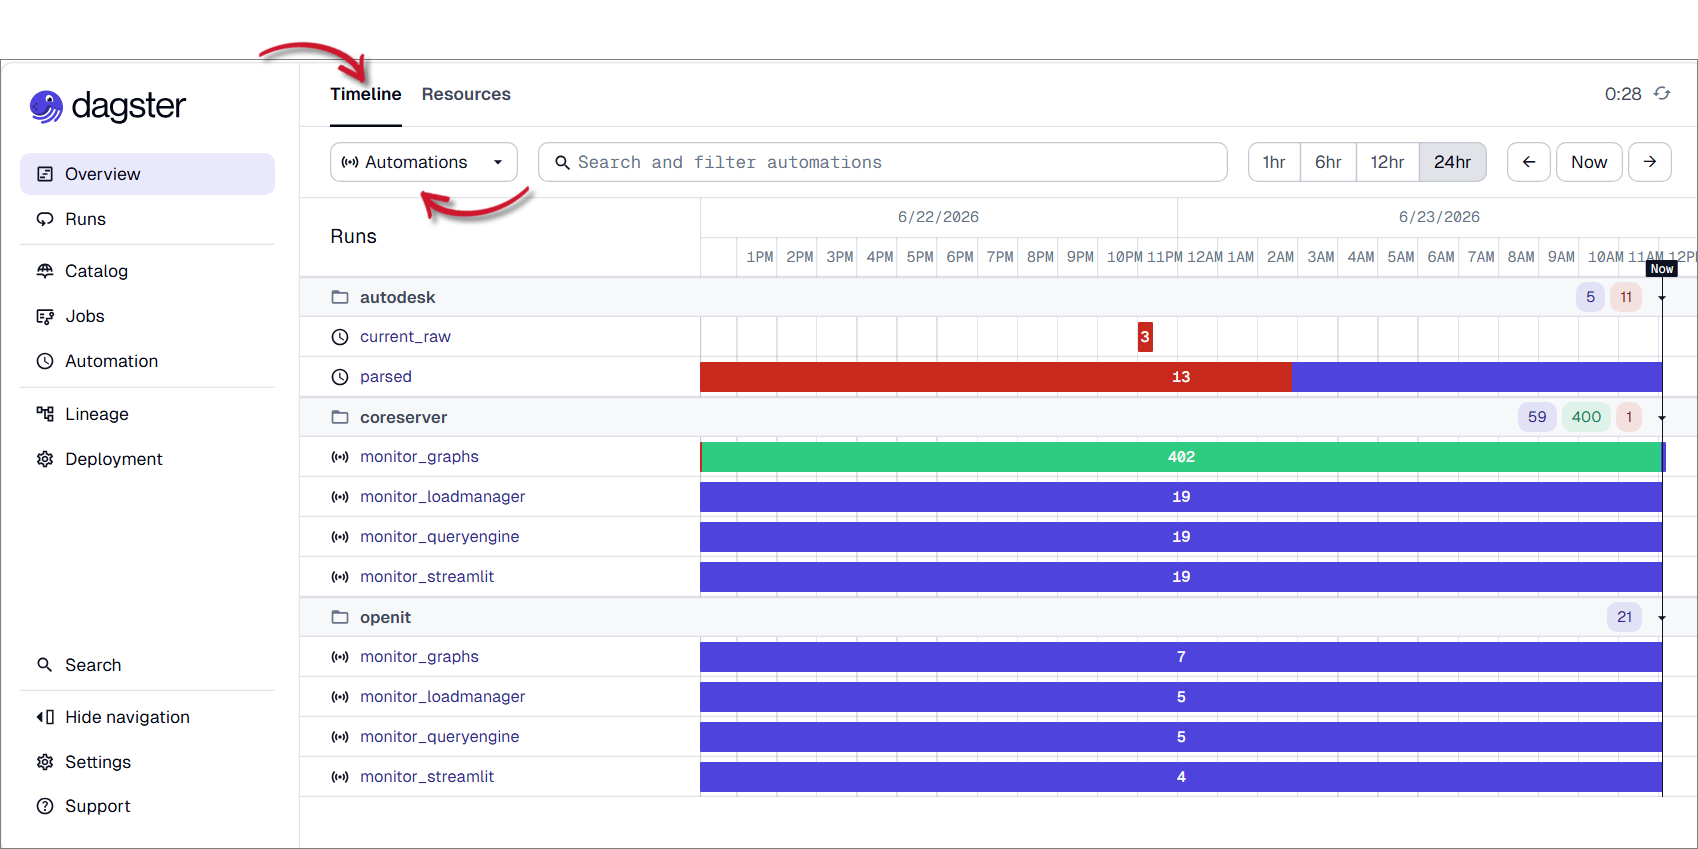 Navigate to Automations
 -
Verify that the automations listed under the Runs section are in-progress or have successful executions.
 Verify Automations
Each row represents an automation that may contains the following:
Indicator Description This indicates successful executions. This indicates in-progress executions. This indicates failed executions. Automation Status Indicators
tipYou may use the available time filters (e.g.
1hr,6hr,12hr, and24 hr) to adjust the displayed period.
Verifying Jobs
The Jobs view provides a timeline of job executions across all configured code locations that are associated with Open iT components.
To check the status of jobs:
-
Access the Data Processing GUI (Dagster).
-
In the left navigation pane, select Overview.
Select Overview -
Go to the Timeline tab, then select Jobs from the dropdown menu located at the upper-left part of the page.
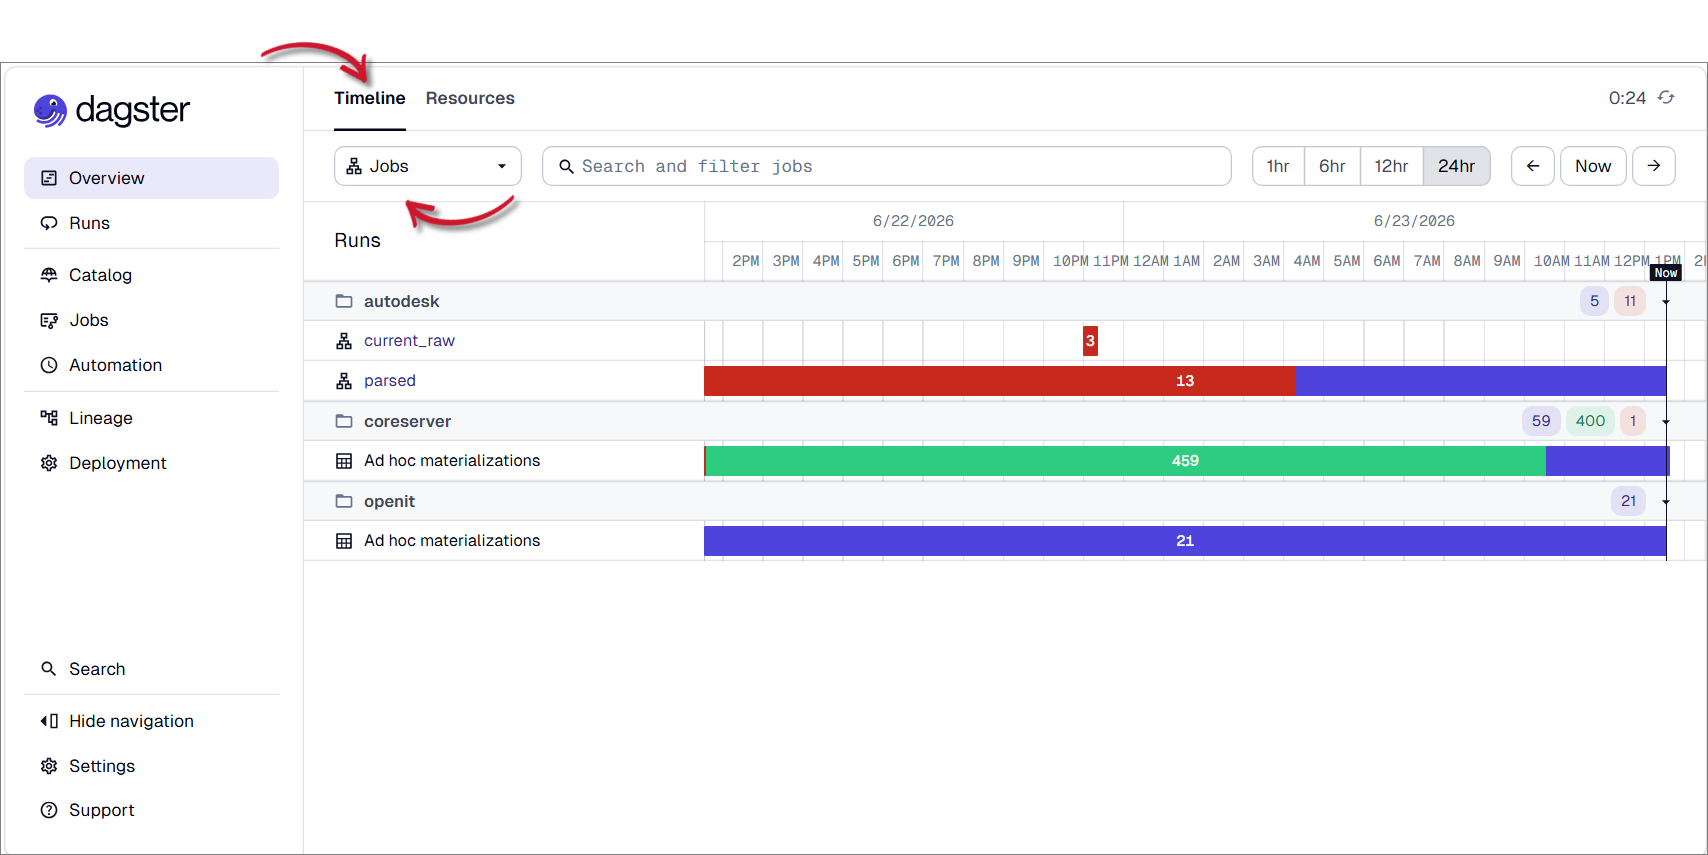 Navigate to Jobs
 -
Verify that the jobs listed under the Runs section are in-progress or have successful executions.
 Verify Jobs
Each row represents a job that may contain the following:
Indicator Description This indicates successful executions. This indicates in-progress executions. This indicates failed executions. Job Status Indicators
tipYou may use the available time filters (e.g.
1hr,6hr,12hr, and24 hr) to adjust the displayed period.