Viewing Forecast Results
The Forecast tab displays the latest forecast result for the selected feature, along with prediction insights and previously saved forecast runs. Use this page to review forecast output, compare saved runs, and view additional details about the selected result.
Latest Record
The Latest Record section displays the most recently saved forecast result, including:
- Forecast model used
- Number of future steps
- Date and time when the forecast was saved
Click More details to display additional information about the forecast. When the details are expanded, click Hide details to collapse them.
Prediction Insights
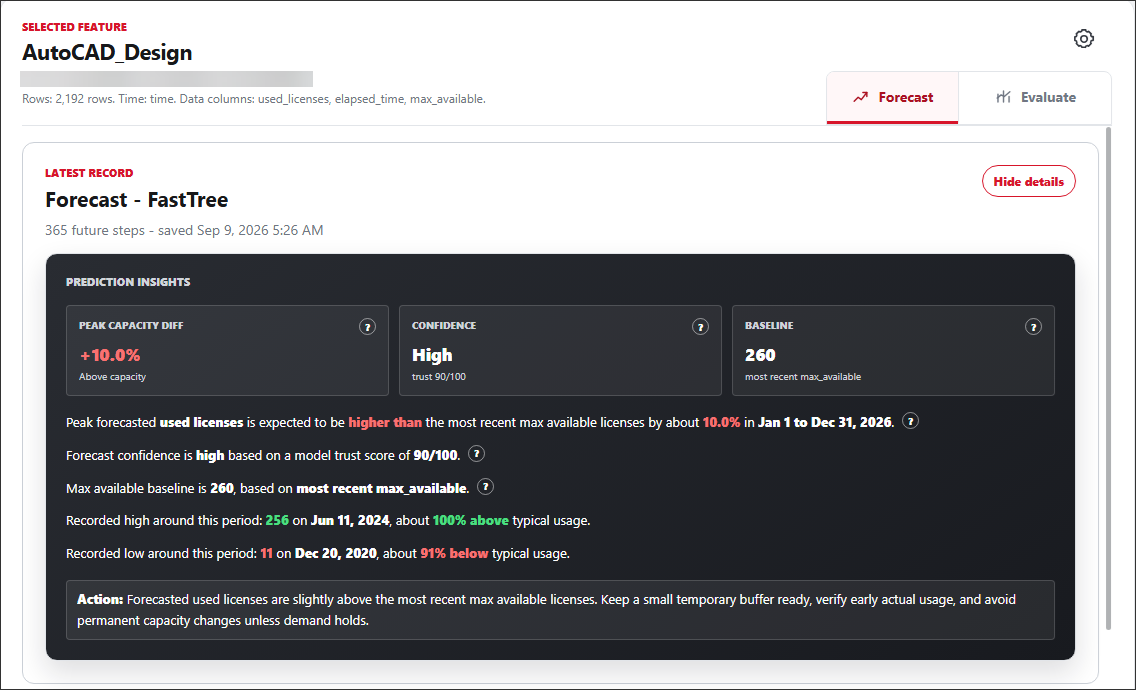
The Prediction Insights section summarizes important information about the forecast.
The available insights include:
- Peak Capacity Diff – Shows the percentage difference between the peak forecasted
used_licensesvalue and the most recentmax_availablevalue. - Confidence – Indicates the confidence level of the forecast based on the model trust score.
- Baseline – Shows the reference
max_availablevalue used when evaluating forecasted license usage.
LicensePredictor also provides a summary of these values and may display a suggested Action based on the forecast result.
Forecast Chart
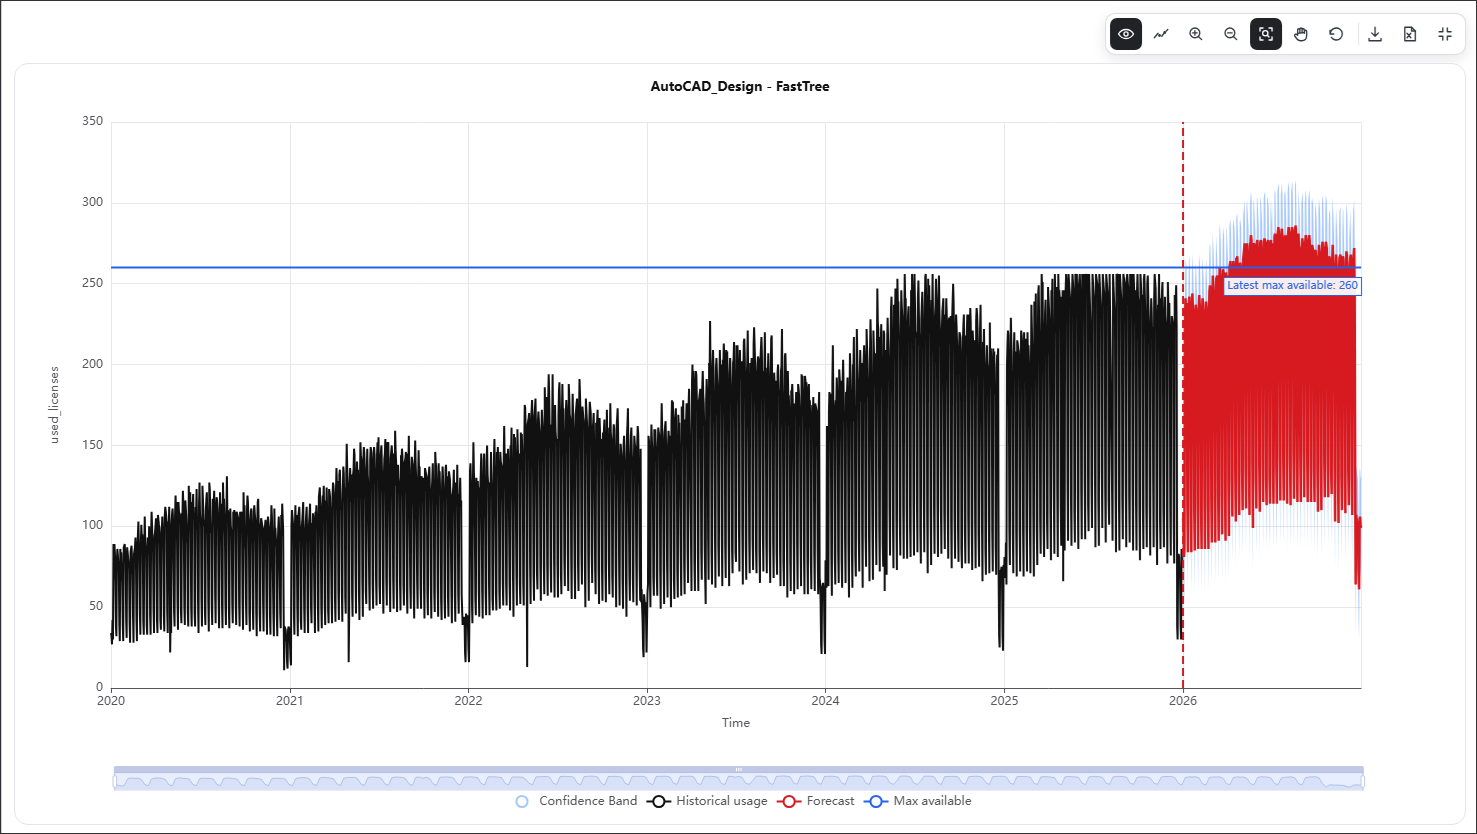
The Forecast Chart provides a visual comparison of historical license usage, forecasted usage, and available license capacity over time.
The chart displays the following:
- Historical usage – Shows the recorded license usage before the forecast period.
- Forecast – Shows the predicted license usage for each period in the forecast horizon.
- Confidence Band – Shows the lower and upper prediction bounds based on the selected confidence band.
- Max available – Shows the available license capacity used as a reference for comparing forecasted usage.
Hover over a data point to view the forecast, lower bound, and upper bound for the selected period.
Use the range selector below the chart to adjust the time period displayed.
The chart toolbar provides additional options for interacting with the chart, such as zooming, panning, resetting the view, and downloading the chart or its data.
The confidence band represents the uncertainty around the forecast. It does not guarantee that actual license usage will remain within the displayed range.
Prediction Values
The Prediction Values section displays the forecasted value for each future period included in the forecast horizon. It also shows the lower and upper bounds based on the confidence band selected when the forecast was run.
The table contains the following information:
| Column | Description |
|---|---|
| Period | Displays the date or time period represented by the forecast. |
| Prediction | Displays the forecasted value of the selected target column for the corresponding period. |
| Lower Bound | Displays the lower limit of the prediction interval based on the selected confidence band. |
| Upper Bound | Displays the upper limit of the prediction interval based on the selected confidence band. |
The selected Confidence Band is displayed above the table. For example, a 90% interval shows the lower and upper bounds calculated using the 90% confidence band selected when the forecast was run.
Use Previous and Next to browse through the prediction values when the forecast contains multiple pages.
Click Export CSV to export the prediction values to a CSV file.
The lower and upper bounds represent the uncertainty around each predicted value. They do not guarantee that the actual value will fall within the specified range.

Dataset Health Check
The Dataset Health Check provides an overview of the quality and suitability of the historical data used for forecasting. Each check displays a status to help identify potential data issues that may affect the forecast. It assesses three key aspects of the dataset:
-
Latest Data – Checks how recent the latest timestamp in the dataset is. This is useful for regularly updated data. Historical datasets may be reported as outdated even when they are valid for testing or analysis.
The following table describes the health status thresholds for each aspect.
Status Criteria Healthy 30 days or less Monitor 31-547 days Warning 548-730 days Critical More than 730 days Data Health Check Status Thresholds
-
Coverage – Checks whether the dataset contains enough historical data to produce stable seasonality and trend estimates.
The following table describes the health status thresholds for each aspect.
Status Criteria Healthy 730 or more usable historical rows Warning 365–729 usable historical rows Critical Fewer than 365 usable historical rows Data Health Check Status Thresholds
-
Missing Data – Checks for dropped rows and gaps in the expected data cadence that may result in uneven historical data.
The following table describes the health status thresholds for each aspect.
Status Criteria Healthy Less than 5% missing data Warning 5% to less than 15% missing data Critical 15% or more missing data Data Health Check Status Thresholds
The coverage assessment uses a target of 730 historical rows, equivalent to two years of daily data.
The Dataset Health Check section displays the corresponding status for each aspect, helping users identify potential data quality issues that may affect the reliability of the evaluation results.
