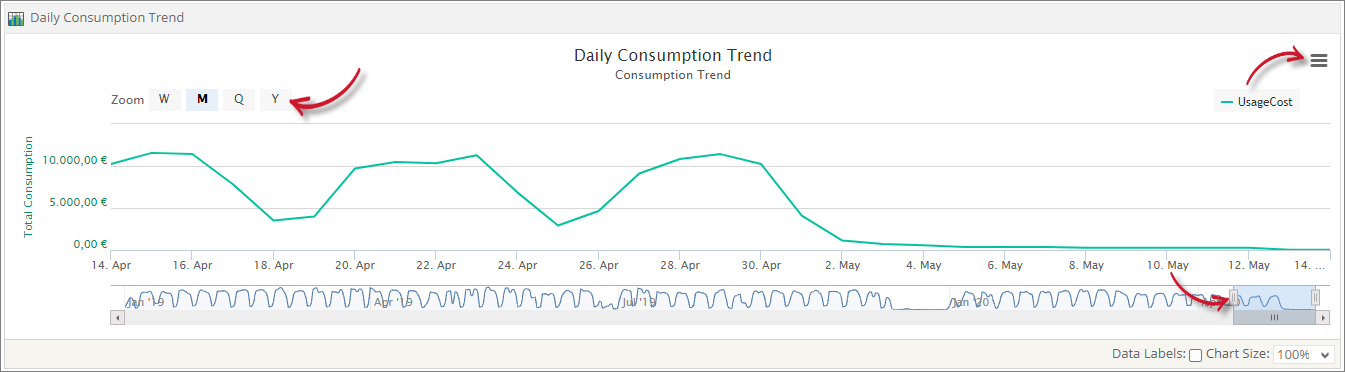
Daily Consumption Trend
A line graph showing the daily trend of license consumption for the selected Vendor and Agreement. This includes applications configured with Distinct User per day (DU-1D) and Distinct Host per day (DH-1D) license metrics.
Chart Functionalities
Click the Zoom item to aggregate the display based on the selection. Monthly is selected by default.
- W - Weekly
- M - Monthly
- Q - Quarterly
- Y - Yearly
Use the slider to zoom in or out to a specific chunk of time.
Daily Consumption Trend
Click the Print and Export button located at the upper-right corner of the portlet to export the current data displayed.