#
User Usage Data and Trends Dashboard
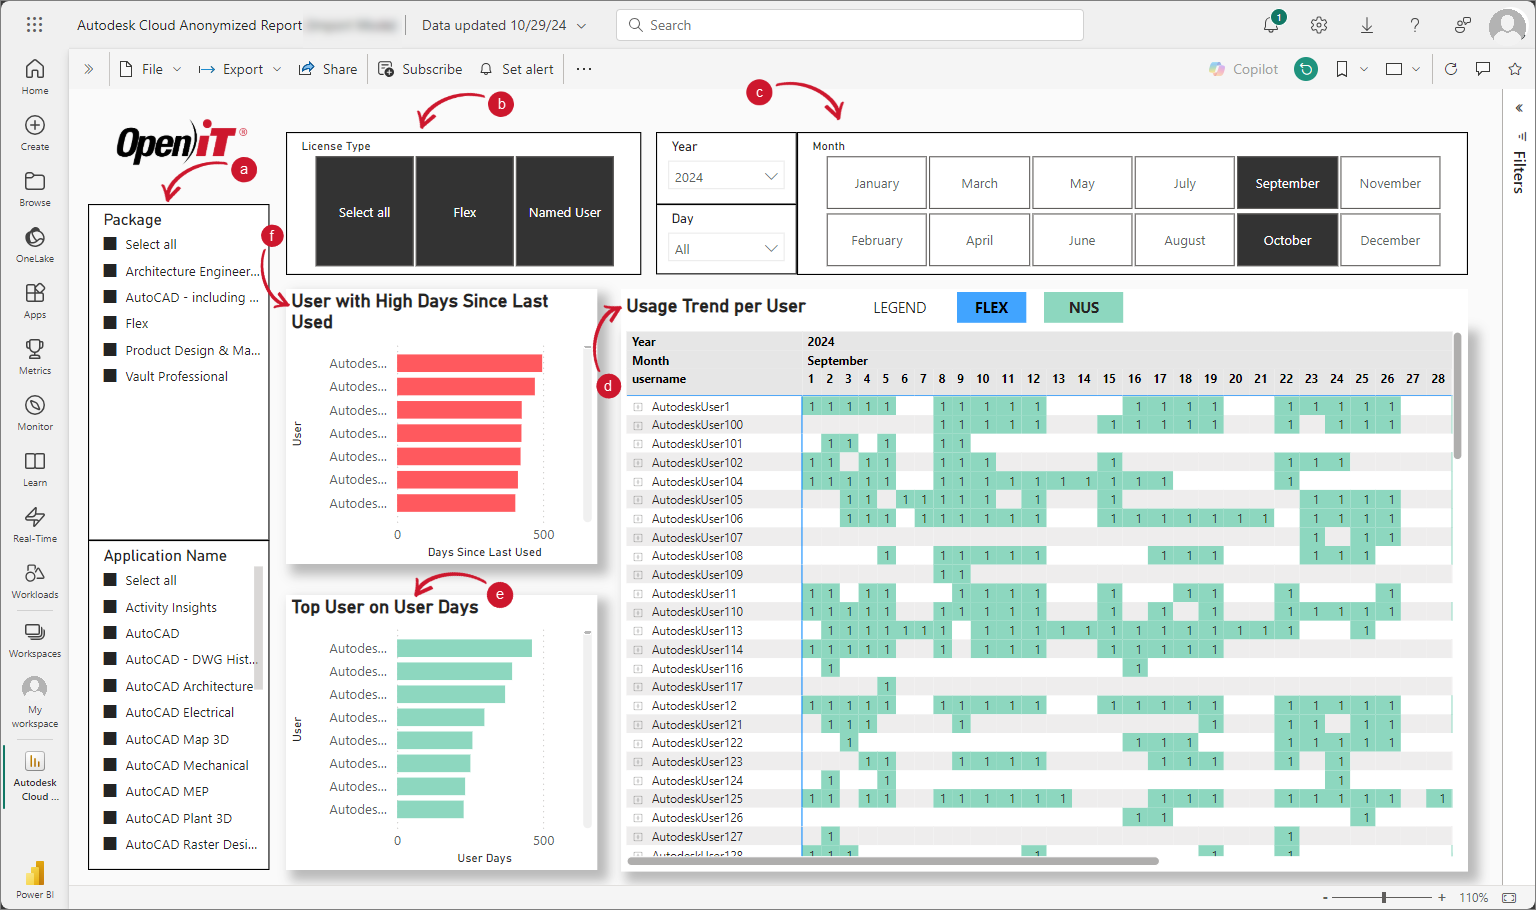
The User Usage Data and Trend dashboard provides an overview of individual user behavior, including days since last usage, top users by activity, and usage trends over time.
Package and Application Selector
This allows Autodesk administrators to select and filter data by Autodesk package and its corresponding applications.License Type Filter
This enables filtering of data by license type to analyze usage trends across different licensing options.Date Range Selector
This provides a filtering option to customize data view for specific time frames.Usage Trend per User
This heatmap displays daily activity for each user, helping Autodesk administrators track user activity patterns over time. The color-coded usage allows administrators to quickly identify which subscription a user is utilizing on a given day.Top User on User Days
This is a chart that assists Autodesk administrators in identifying the most active users based on the total number of days they have been active.User with High Days Since Last Used
A chart displaying users with the highest number of days since using their assigned license.