#
Token Usage Dashboard
The Token Usage dashboard provides a comprehensive view of Autodesk usage across subscriptions, teams, and applications. This dashboard consists of several interactive and visual components designed to offer granular insights into Autodesk token usage. Below are the following dashboard components:
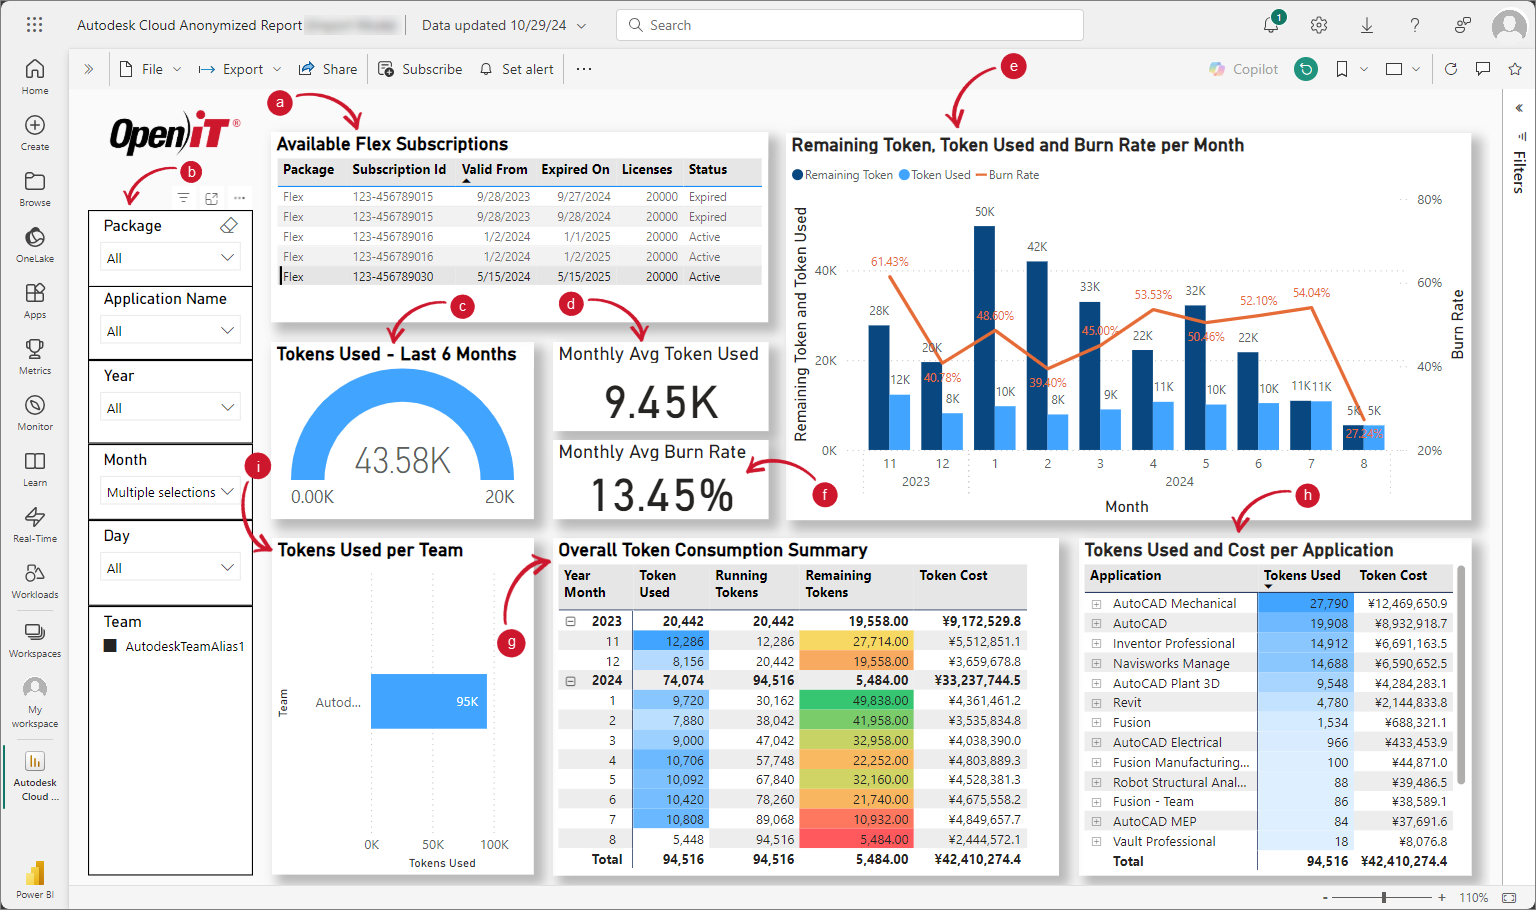
Available Flex Subscription Table
This table displays the status of Autodesk Flex subscriptions. This helps Autodesk administrators to quickly access which subscriptions are active or need renewal to make sure uninterrupted service.Filter Pane
This allows Autodesk administrators to filter data to suit specific analysis needs through filters available.Tokens Used - Last 6 Months
This chart provides an overview of recent token usage helping Autodesk administrators to track overall consumption trends.Monthly Average Token Used
This provides an overview of typical token consumption.Remaining Tokens, Tokens Used, and Burn Rate per Month
This chart guides Autodesk administrators to track month-over-month token usage and burn rate to pinpoint periods of high or low consumption.Monthly Average Burn Rate
This metric guides Autodesk administrators evaluate token usage efficiency over time through average percentage of tokens burned each month.Overall Token Consumption Summary
This summarizes token usage and costs by year and month providing an in-depth breakdown of token consumption.Tokens Used and Cost per Application
This presents token usage and costs categorized by Autodesk application enabling Autodesk administrators to identify applications with high token consumption.Tokens Used per Team
This is a chart showing total tokens consumed by each team assisting Autodesk administrators to assess team-level token usage.
#
Next Steps?
To have an in-depth understanding on seat assignments, user activity and license usage trends for Autodesk named users, proceed to Named User Usage Dashboard.