We’re upgrading your documentation experience!
A new doc website is live at docs.openit.cloud — a temporary preview during our transition. This website is now in maintenance-only mode (only critical issues will be addressed).
Explore the new website and send us your feedback!
#
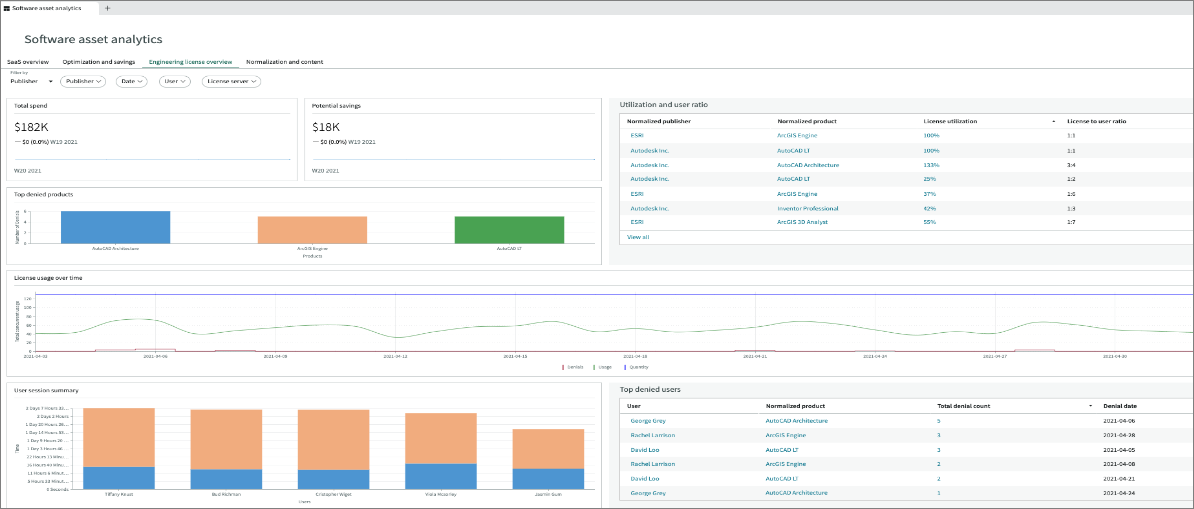
Dashboard - Engineering License Overview
ServiceNow provides a dashboard called Engineering License Overview for engineering applications. It provides insights into your engineering applications license position and usage. You can access it by navigating to Software asset > Software Asset Workspace > Software asset analytics > Engineering license overview.
Only products and publishers that belong to engineering applications and are listed in the Engineering Application License (samp_eng_app_license) table appear in the filter.
#
Dashboard Metrics
The dashboard contains the following reports and charts:
Only Active is supported in the User session summary metric.
#
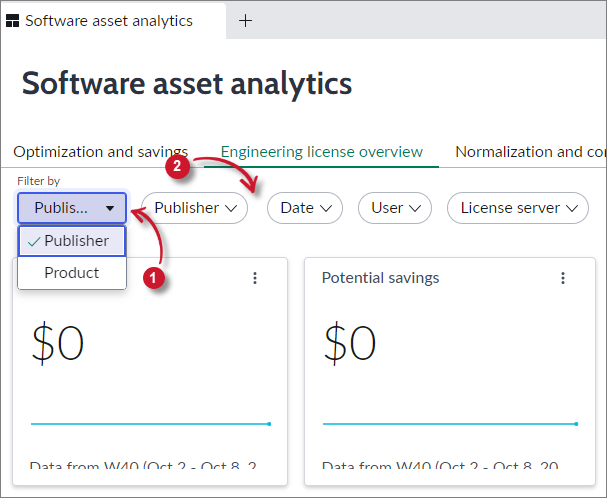
Filtering the Dashboard
The dashboard provides capability to narrow down the results displayed in all of the metrics. To filter the results, follow these instructions:
In the upper-left corner of the dashboard, choose among the available criteria – Publisher or Product.
If you need to narrow it down further, choose among the available fields – Product/Publisher, Date, User, or License server.
 ServiceNow Integration: Dashboard Filter
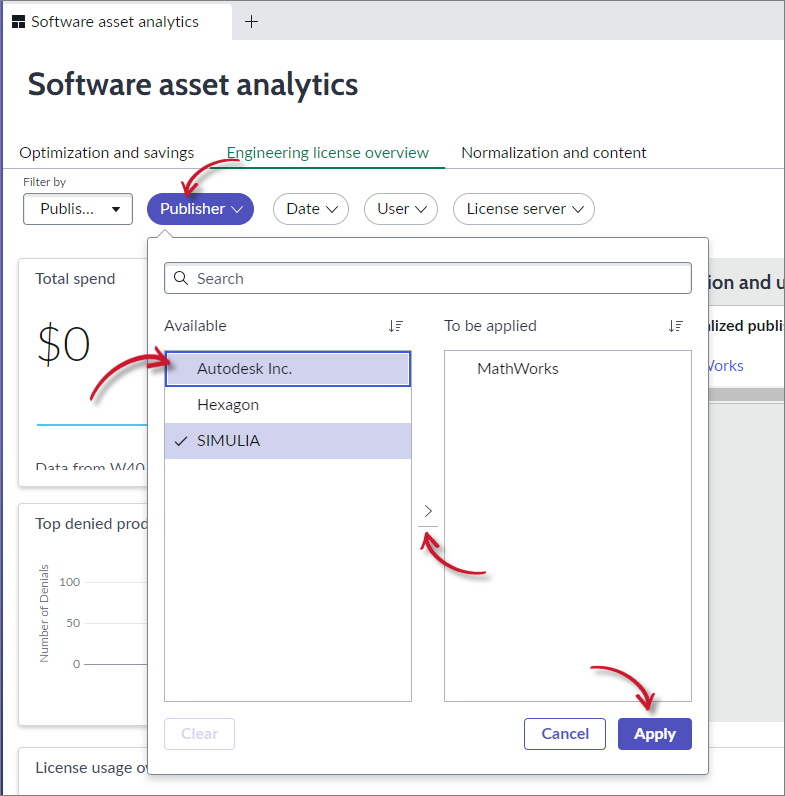
This will open a panel containing the available values. Simply select the items from the Available panel and click the greater than symbol (>) to apply the selection. Click Apply.
 ServiceNow Integration: Dashboard Filter Criteria
The page will automatically refresh based on the selection.
If no product or publisher is selected, the cumulative data for all products and publishers belonging to engineering applications appear.
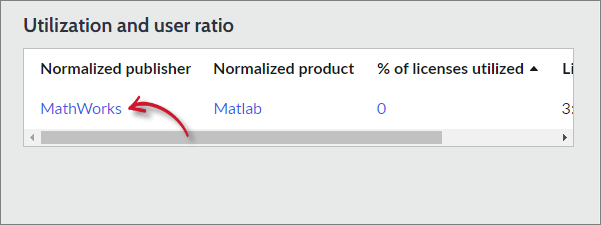
To see the details of a specific item in a report, click the item.
 ServiceNow Integration: Dashboard Select Item
It will be redirected to the details or records view of the selected item.
 ServiceNow Integration: Dashboard Item Detail/Records View