We’re upgrading your documentation experience!
A new doc website is live at docs.openit.cloud — a temporary preview during our transition. This website is now in maintenance-only mode (only critical issues will be addressed).
Explore the new website and send us your feedback!
This page is intentionally hidden from navigation but remains accessible via direct link. It is retained for internal reference purposes only and may contain outdated or transitional content.
#
LicensePredictor Web Interface
#
Parts of the LicensePredictor
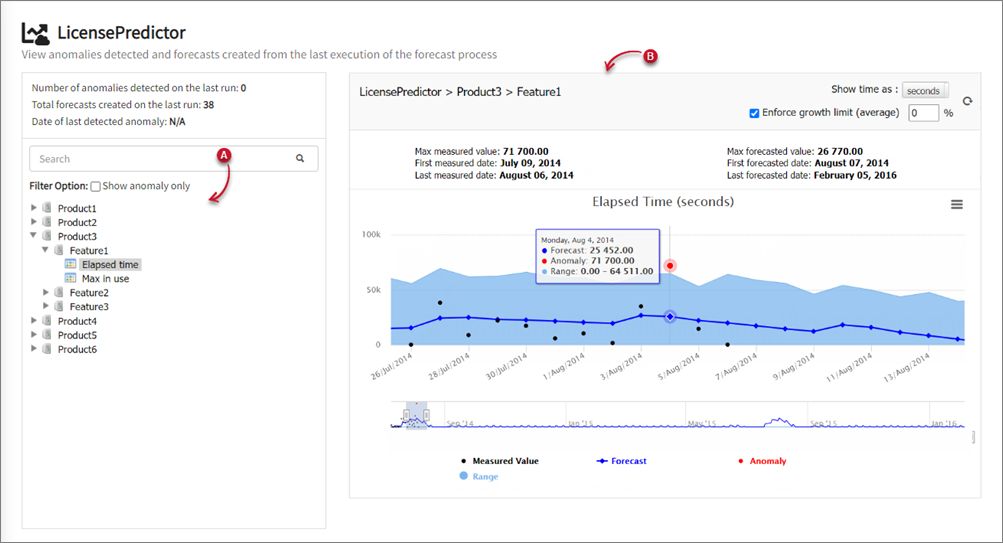
The LicensePredictor has two major parts, the (A) Data Pane and the (B) Chart Pane.
#
LicensePredictor - Data Pane
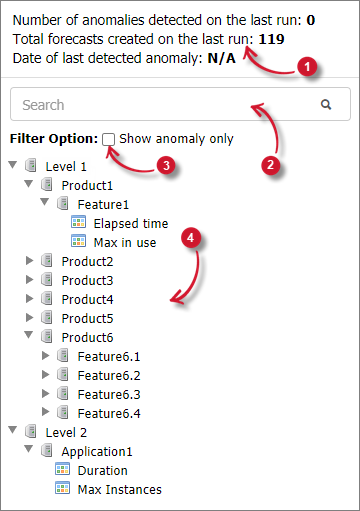
This pane contains the data available for reporting. The following functionalities are available for easy navigation between data:
Summary - shows the total number of anomalies detected from the latest data loaded, the total number of forecasts created from the last execution of the forecast process, and the latest date wherein an anomaly was detected
Search - filters the list based on the user input
Filter Option - tick this to update the list to only show vendor licenses with anomaly
Data Details - list of Vendor Licenses and Features per Level; click the drop-down arrow to:
Level 1 - show the feature(s) under a specific vendor license; show the available measurements of a feature
Level 2 - show the vendor license(s); show the available measurements of a vendor license
#
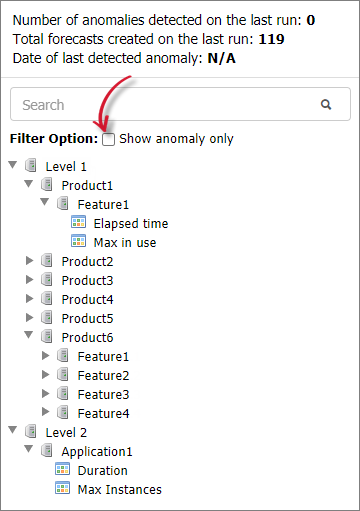
Filtering on LicensePredictor
To filter the LicensePredictor data to only show vendor licenses with anomalies, tick the Filter Option to Show anomaly only.
#
LicensePredictor - Chart Pane
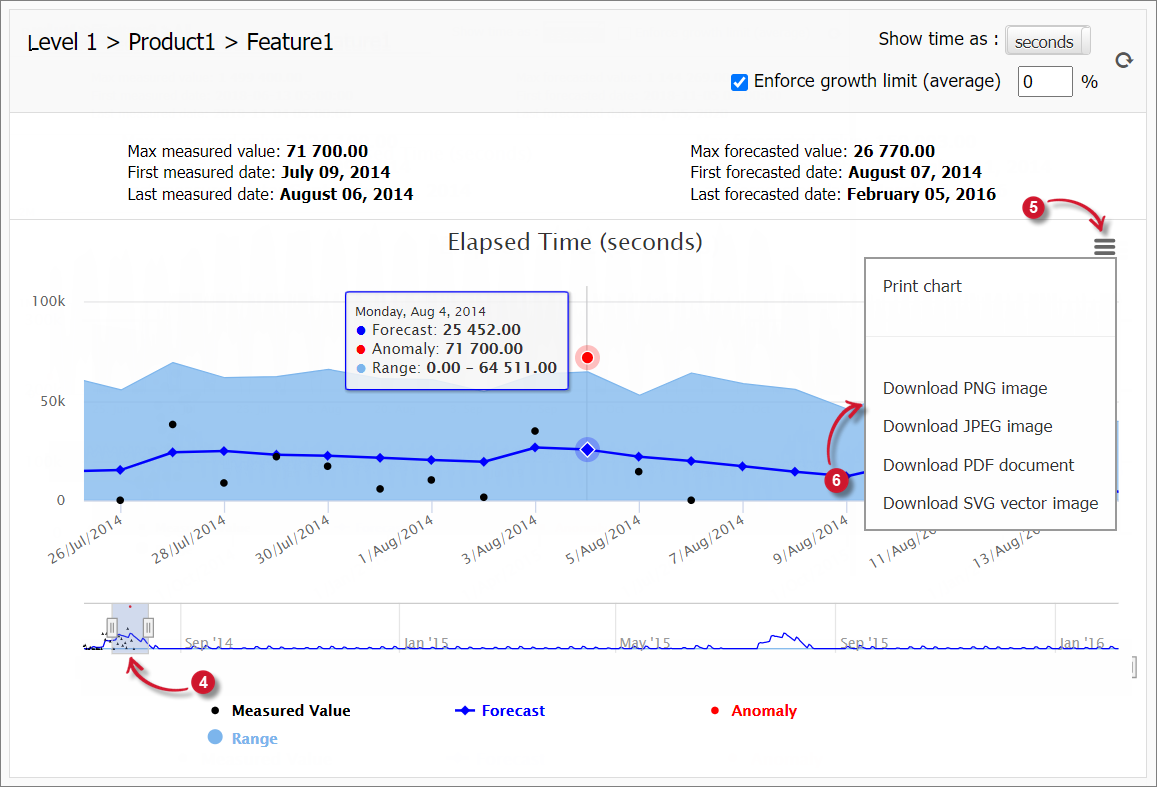
The LicensePredictor chart pane displays the forecast for the selected measurement on the data pane.
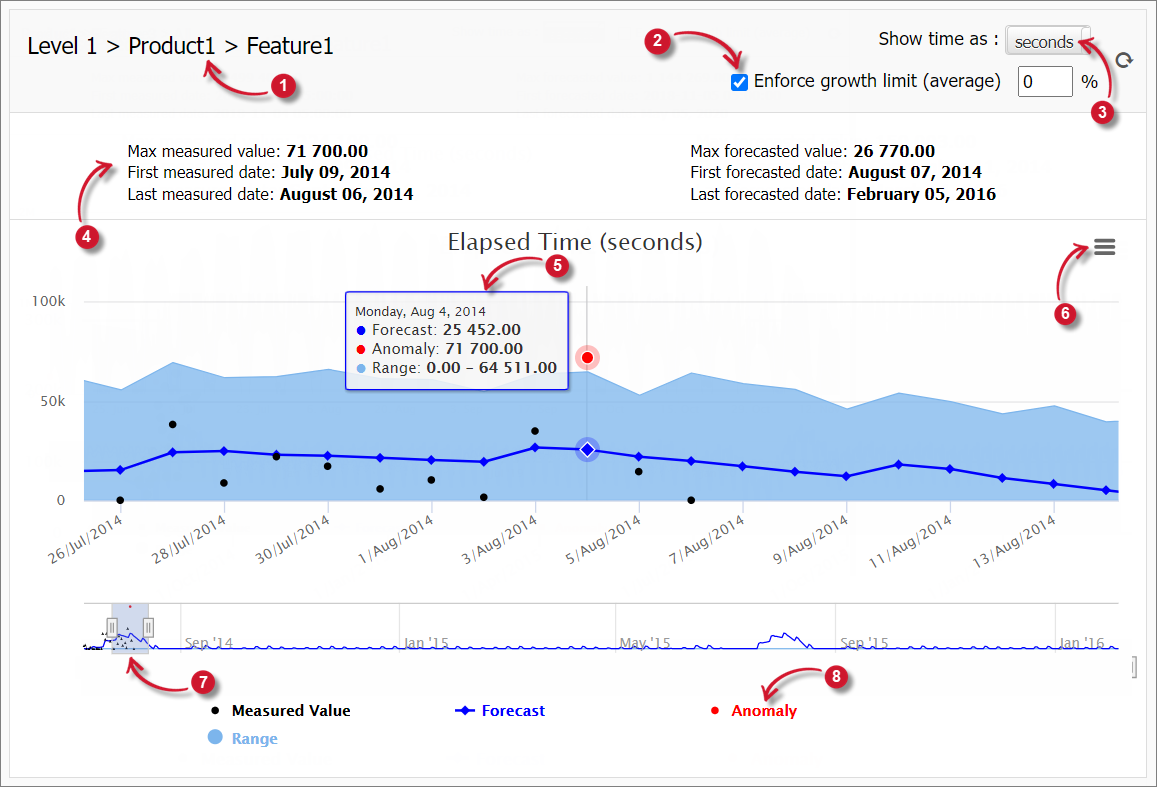
Selected Data - information on the selected item on the Data Pane
Growth Limit - an option to enforce growth limit
Interval - an option to show time interval as seconds or hours
Summary - shows the Max measured value, Max forecasted value, First measured date, First forecasted date, Last measured date, and Last forecasted date
On-hover details - hover over each component of the chart to see the values of each day
Print/Download option - print or download the chart in various formats; to do this:
Click the Chart context menu on the upper-right portion of the chart.
Select the desired format from the available options.
Selected Date - the selected date range shown in the graph
Chart Legend
Measured Value - the value of the measurement taken each day
Forecast - the forecasted value or the prediction for the measurement each day
Anomaly - a measured value outside the forecasted range
Range - the range of the forecasted values for the measurement classified as normal based from the historical data
Max available licenses - the maximum number of licenses available which is only available when Max in use measurement is used
#
Enforcing Growth Limit on LicensePredictor
Enforcing a growth limit enforces an additional model assumption to limit the growth in the forecast to stabilize and match the average level of the past values (historical data). Not enforcing the additional model assumption extrapolates the historical data trends and other seasonality factors.
For example, at 0% growth, the average value of the forecast will be limited to the average value of the historical measurements. At 50% growth, the average value of the forecast will be limited to 1.5 times the average value of the historical measurements. And at 100% growth, the average value of the forecast will be limited to twice the average value of the measurements.
Follow these instructions to enforce growth limit:
Go to the Forecasting tab.
Select the data to show from the data pane.
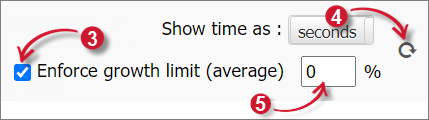
Tick the Enforce growth limit (average) checkbox.
Click the Reload chart icon.
To adjust the growth capacity, type in the desired growth rate on the text box provided, then click the Reload chart icon.
The growth limit is enforced when the amount of data collected is one year or less.
#
Printing or Downloading LicensePredictor Chart
Go to the Forecasting tab.
Select the data to show on the data pane.
Select the measurement of the feature to show the graph on the chart pane.
Adjust the date selector to select the date range to show on the chart.
On the upper-right corner of the chart, click the Chart context menu icon.
Select whether to Print or Download the chart based on preferred image format.