We’re upgrading your documentation experience!
A new doc website is live at docs.openit.cloud — a temporary preview during our transition. This website is now in maintenance-only mode (only critical issues will be addressed).
Explore the new website and send us your feedback!
#
ETAP License Manager
#
Introduction
Open iT supports ETAP usage reporting by collecting log files and converting them to Open iT format.
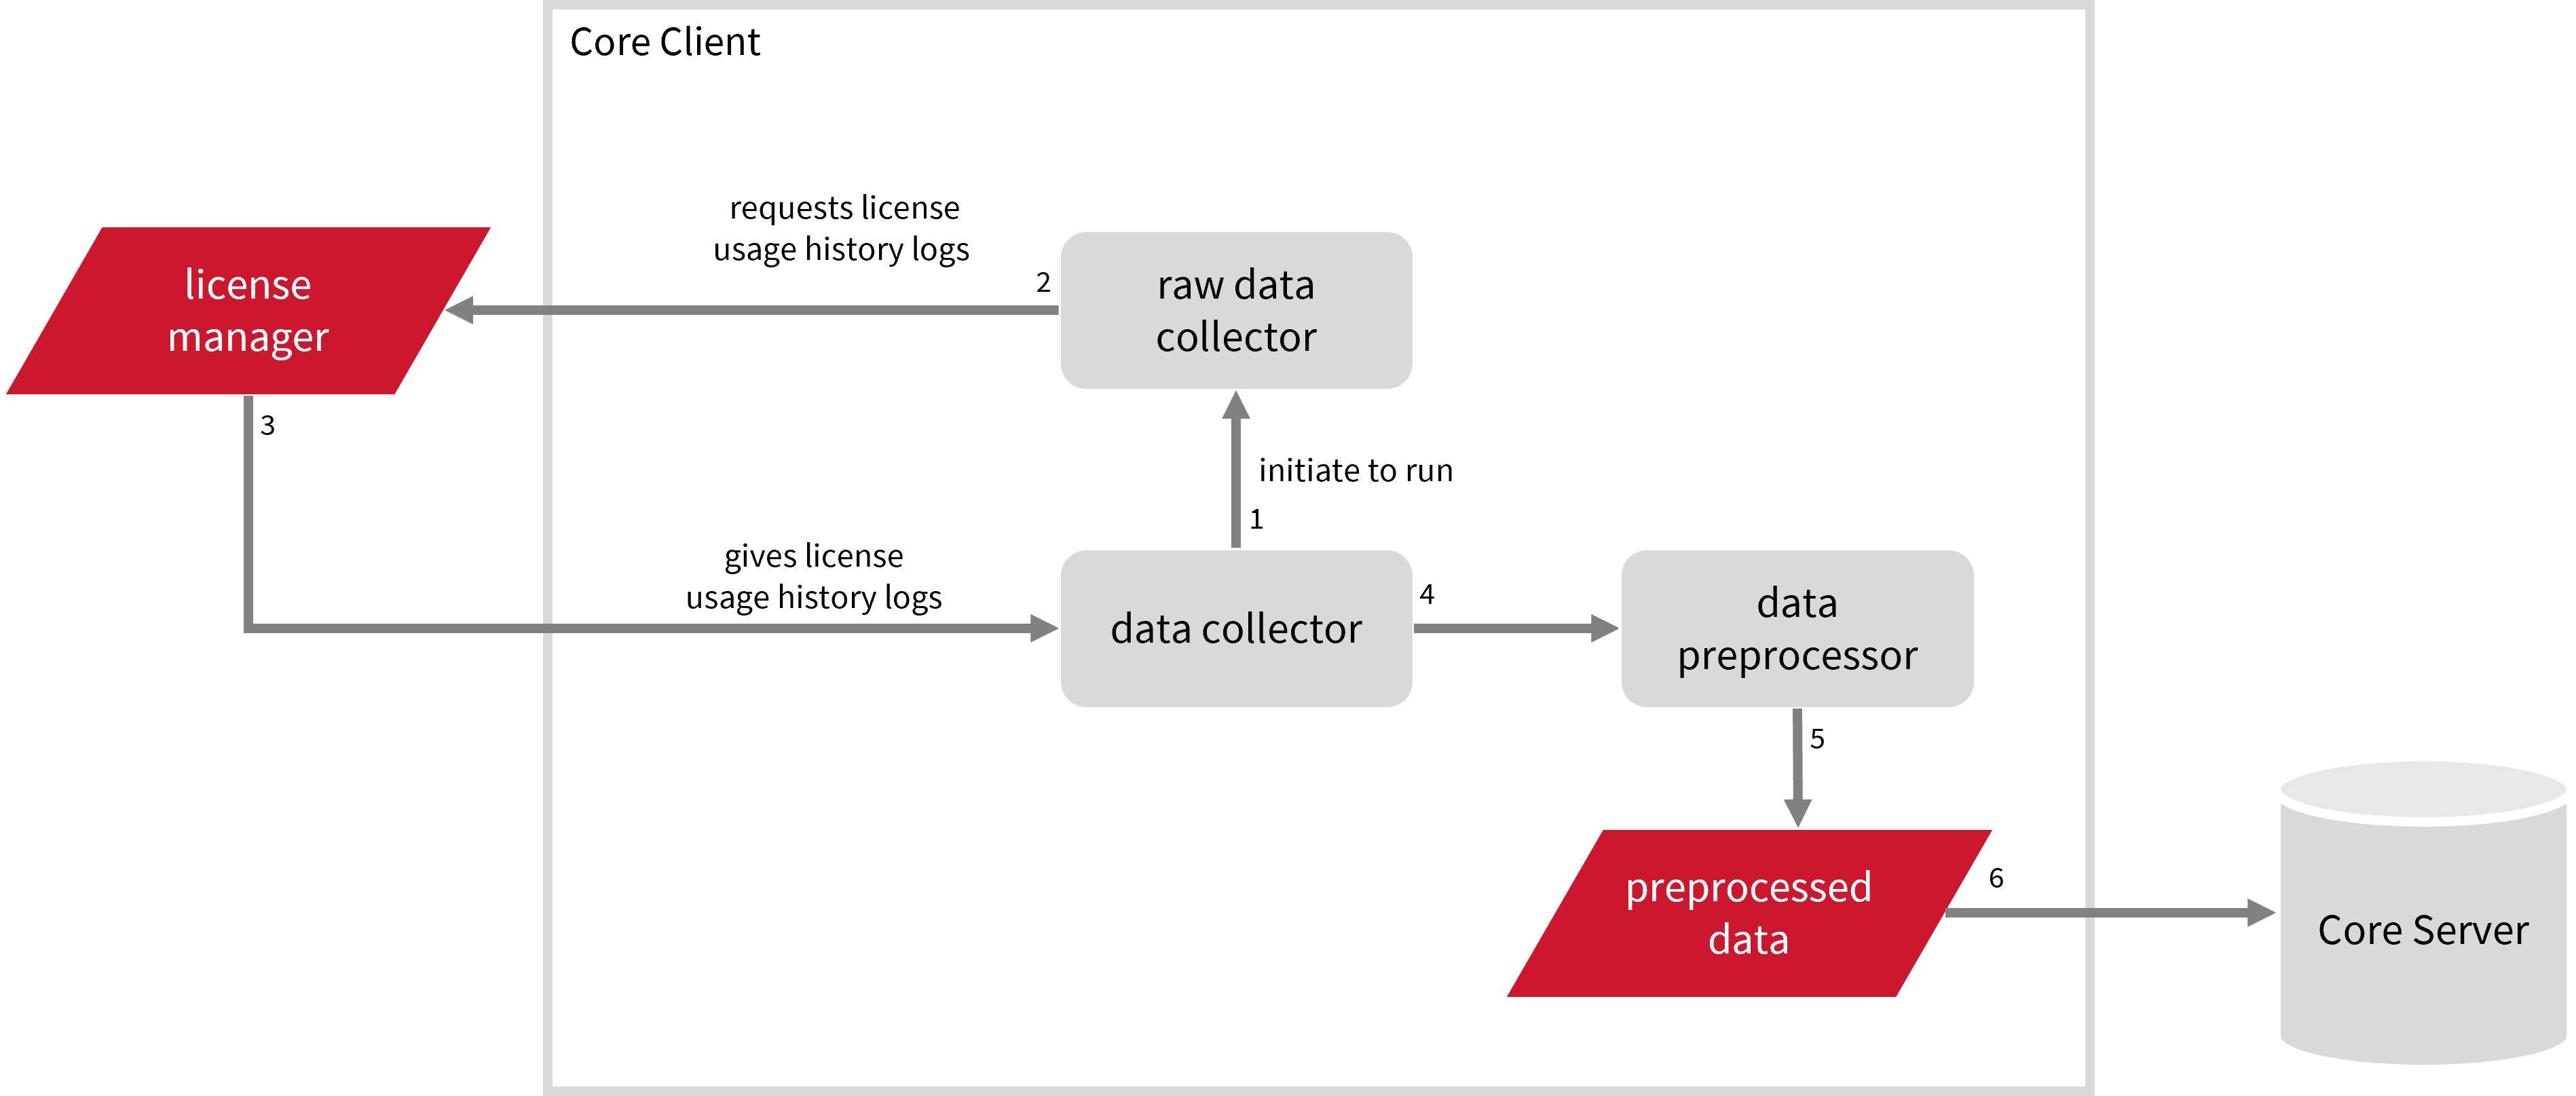
An Open iT client is installed on your license server, and the license server does not create license usage history logs for this collection. The data collector initiates the raw data collector to request license usage history logs from the license manager every hour, triggering the data collection process. Once the logs are received, the raw data collector passes them to the data collector. The collected data is then sent to a data preprocessor for processing. After preprocessing, the final preprocessed data is sent and stored in the Core Server.
The following sections will guide you in setting up the necessary configuration to collect and send the required data to the server.
Apply the configurations shown in the Open iT client.
#
Requirements
- An Open iT Client connected to an Open iT Server or a coexistent Open iT setup
- License server administrative rights
#
Activating Raw Data Collection
These are the required steps to activate collection of raw data from the ETAP license manager.
Open a command prompt with Administrator level privileges.
Go to the bin directory, which is by default in
C:\Program Files\OpeniT\Core\bin, run the command:Command Syntaxcd $BIN_DIRExamplecd C:\Program Files\OpeniT\Core\binOnce in the directory, activate the collection of raw ETAP data, run the command:
Command Syntaxopenit_oconfinit -u "collect_license_etap-raw.root.scheduler.jobs.collect_etap_licenselogs-raw.general.active=true"
#
ETAP Events Log File Collection Configuration
This will produce the following aggregated data types used for historical reporting:
#
Activating Event Log Data Collection
ETAP Event Log Data Collection is active by default. If it is inactive, follow these instructions to activate:
Open a command prompt with Administrator level privileges.
Go to the bin directory, which is by default in
C:\Program Files\OpeniT\Core\bin, run the command:Command Syntaxcd $BIN_DIRExamplecd C:\Program Files\OpeniT\Core\binOnce in the directory, activate the collection of ETAP event log data, run the command:
Command Syntaxopenit_oconfinit -u "collect_license_etap_event-logs.root.scheduler.jobs.collect_etap_licenselogs-events.general.active=true"
To configure the intervals in the data collection, locate and set the instances attribute under collect_etap_licenselogs-events, preprocess_etap_licenselogs-events, or transfer_etap_licenselogs-events in the file collect_license_etap_event-logs.oconf, which is by default in C:\Program Files\OpeniT\Core\Configuration\scheduler.
Refer to the ETAP Event Log Job Scheduler Instances Configuration table to learn the attributes used to configure ETAP events data collection and transfer.
#
Verifying Event Log Data Collection
After configuration, you can verify that the data is collected and sent to the server by following these steps:
Open a command prompt with Administrator level privileges.
Go to the bin directory, which is by default in
C:\Program Files\OpeniT\Core\bin, run the command:Command Syntaxcd $BIN_DIRExamplecd C:\Program Files\OpeniT\Core\binRun the command:
Command Syntaxopenit_executor -r collect_license_etap_event-logsVerify that the system creates a LogParserEtap directory containing
license-usage-etap-event.tempfile in the temp directory, which is by default inC:\Program Files\OpeniT\Core\Log\temp.
#
ETAP Records Log File Collection Configuration
This will produce the following aggregated data types used for historical reporting:
- (89) Total License Use Licenseevents
- (90) Individual License Use Licenseevents
- (91) Usergroup License Use Licenseevents
- (108) Host License Use Licenseevents
- (109) Hostgroup License Use Licenseevents
#
Activating Record Log Data Collection
ETAP Record Log Data Collection is active by default. If it is inactive, follow these instructions to activate:
Open a command prompt with Administrator level privileges.
Go to the bin directory, which is by default in
C:\Program Files\OpeniT\Core\bin, run the command:Command Syntaxcd $BIN_DIRExamplecd C:\Program Files\OpeniT\Core\binOnce in the directory, activate the collection of ETAP record log data, run the command:
Command Syntaxopenit_oconfinit -u "collect_license_etap_record-logs.root.scheduler.jobs.collect_etap_licenselogs-records.general.active=true"
To configure the intervals in the data collection, locate and set the instances attribute under collect_etap_licenselogs-records, preprocess_etap_licenselogs-records, or transfer_etap_licenselogs-records in the file collect_license_etap_record-logs.oconf, which is by default in C:\Program Files\OpeniT\Core\Configuration\scheduler.
Refer to the ETAP Record Log Job Scheduler Instances Configuration table to learn the attributes used to configure ETAP records data collection and transfer.
#
Verifying Record Log Data Collection
After configuration, you can verify that the data is collected and sent to the server by following these steps:
Open a command prompt with Administrator level privileges.
Go to the bin directory, which is by default in
C:\Program Files\OpeniT\Core\bin, run the command:Command Syntaxcd $BIN_DIRExamplecd C:\Program Files\OpeniT\Core\binRun the command:
Command Syntaxopenit_executor -r collect_license_etap_record-logsVerify that the system creates a LogParserEtap directory containing
license-usage-etap-record.tempfile in the temp directory, which is by default inC:\Program Files\OpeniT\Core\Log\temp.
#
Sample Reports
#
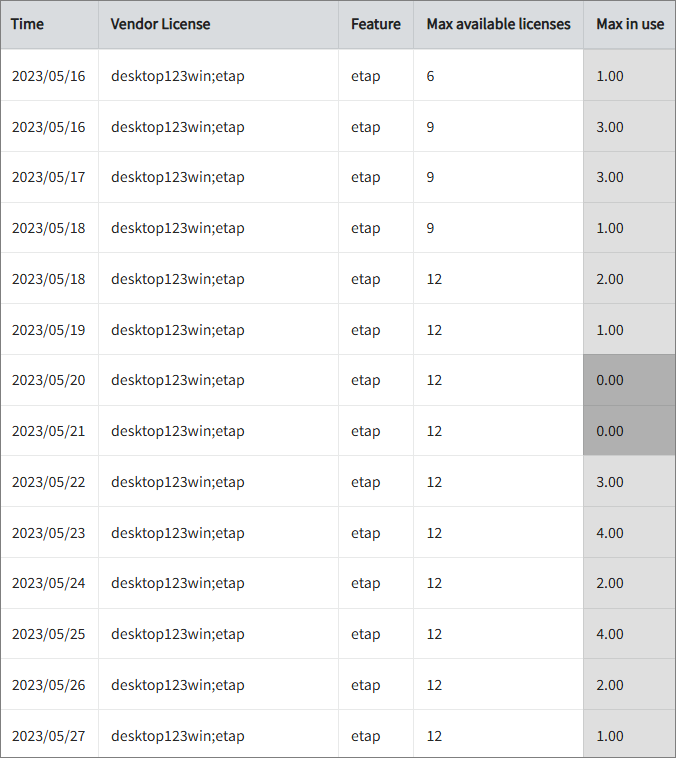
Max Available vs Max in Use
This sample report compares max in-use licenses against max available licenses.
It offers several key benefits:
- Optimized License Allocation – helps ensure you are not over-purchasing licenses you don't need or under-provisioning.
- Cost Savings – identifies opportunities to downgrade or redistribute licenses, reducing unnecessary expenses.
- Usage Trends & Capacity Planning – shows peak usage patterns, allowing better forecasting for future needs.
- Avoiding Service Disruptions – helps prevent situations where users cannot access software due to reaching the license limit.
- Compliance & Audit Readiness – provides a usage record to ensure compliance with vendor agreements and avoid penalties.
- Performance & Productivity Insights – helps assess whether certain teams or departments are under-utilizing or over-utilizing software.
#
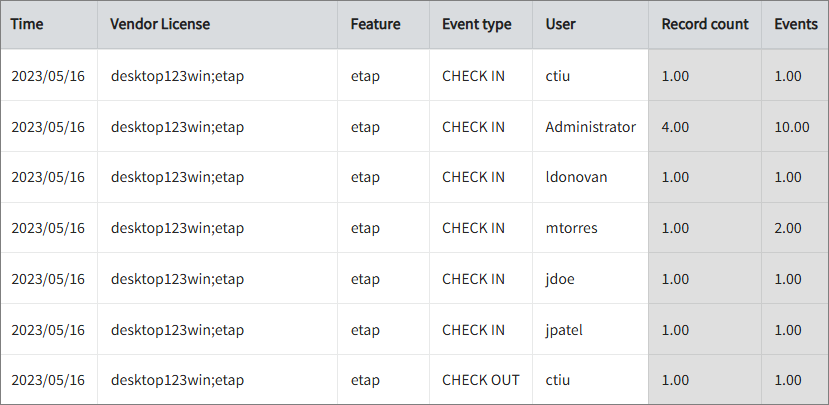
License Usage and Event Logs
This sample report shows the usage and event log of a feature.
It offers several key benefits:
- Optimize Software Spend - Identify underutilized or overutilized licenses to right-size your license pool and reduce unnecessary costs.
- Gain Real-Time Visibility - Track check-in/check-out events, user activity, and license usage in real-time for better operational insight.
- Ensure License Compliance - Maintain audit readiness with detailed logs showing user, host, event type, and time.
- Enhance Engineering Productivity - Pinpoint license bottlenecks that hinder development workflows and ensure critical tools are always available when needed.
- Improve Decision-Making - Use usage data to forecast demand and plan renewals, upgrades, or reallocations with confidence.
- User Accountability - Easily track individual user access to promote responsible software usage and identify training needs.
#
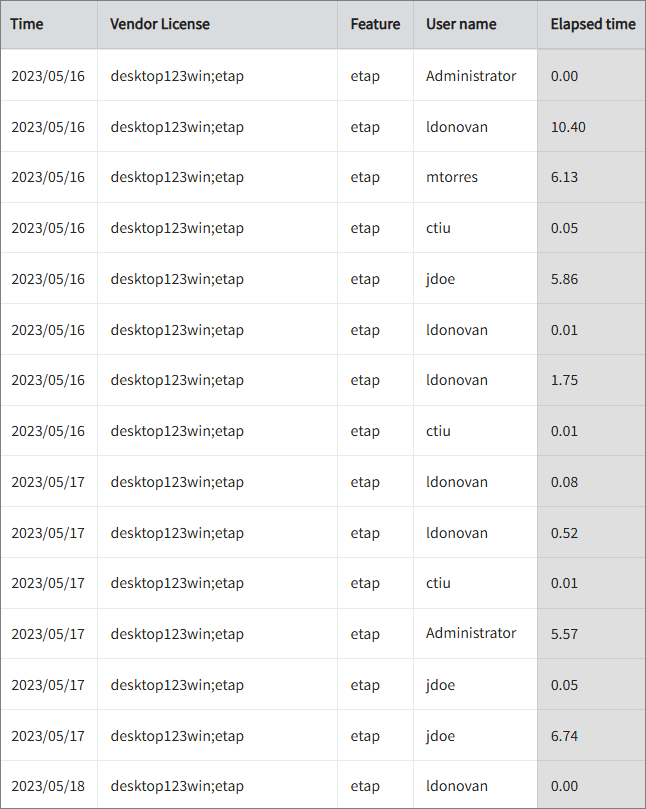
Feature Elapsed Time per User
This sample report gives you helpful insights into software use, performance trends, and user behavior.
It offers several key benefits:
- User Efficiency Analysis – tracks how much time users spend on specific features to help assess productivity.
- Identifying Workflow Issues – highlights any delays or inefficiencies in processes that could be improved.
- Usability & UX Insights – points out features that take longer to use, which could indicate design or functionality improvements.
- Training & Support Guidance – helps identify users who might need extra training to use a feature more effectively.
- Compliance Tracking – makes sure users are spending the right amount of time on regulated tasks.
- Resource & License Optimization – finds underused features or areas where too much time is spent, helping with better resource allocation.