We’re upgrading your documentation experience!
A new doc website is live at docs.openit.cloud — a temporary preview during our transition. This website is now in maintenance-only mode (only critical issues will be addressed).
Explore the new website and send us your feedback!
#
Data Monitor
Recommended reading: Activating Data Monitor Tab
#
Parts of the Data Monitor Tab
This page displays a chart showing the archived historical data in the Core Server. It shows the file count and size with a baseline computed from the number of vendor licenses in license status directory, which is by default C:\ProgramData\OpeniT\Data\license_status, multiplied by 24. It has the following components:
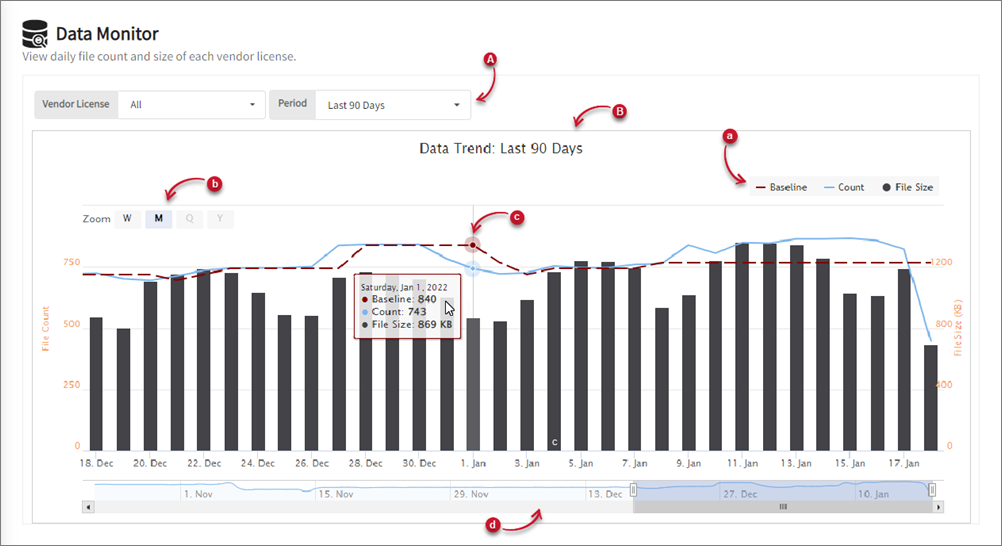
Filters
Vendor License - list of vendor licenses available in the archive
Period - predefined date ranges to be included in the chart reporting
Chart
Legend - list of measures reported in the chart
Date Buckets - list of date ranges to view the data status
Data Labels - hover over a point in the chart to see the details of the data
Navigator - use to easily navigate to specific time frame available in the chart
By default or when there are no filters selected, the chart has the following details presented in the chart:
Summation of all archived data in the licpoll2 folder in the archive directory, which is by default
C:\ProgramData\OpeniT\Data\archive.Baseline - expected number of data file count; it is computed based on the number of products present in the license status directory, which is by default
C:\ProgramData\OpeniT\Data\license_status, ignoring outdated ones, multiplied by 24Count - number of archived data files
File Size - summation of archived data file sizes (in Kilobytes)
Previous 90 days worth of data.
#
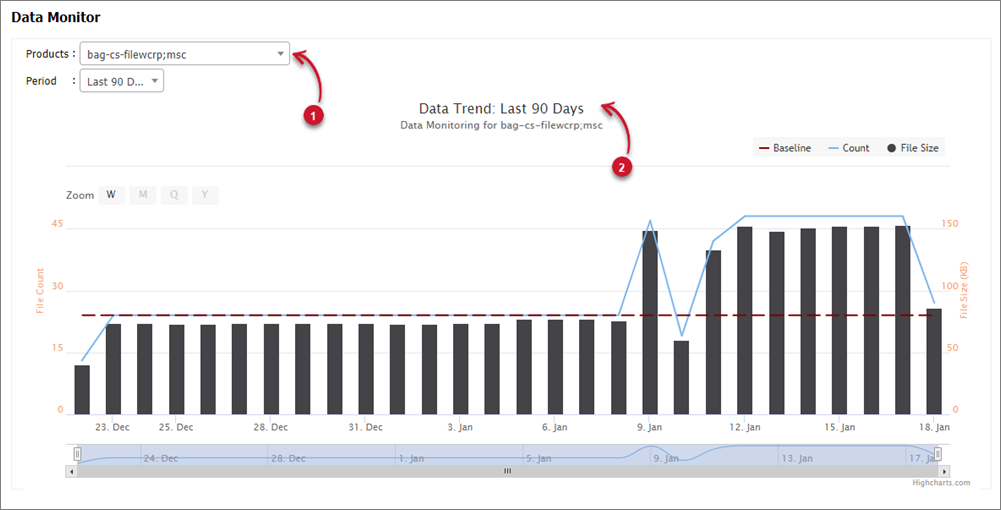
Filtering the Data Monitor Chart
Select one of the items from the Vendor License or Period filter drop-down list.
The selected vendor license or period will be displayed in the title.
#
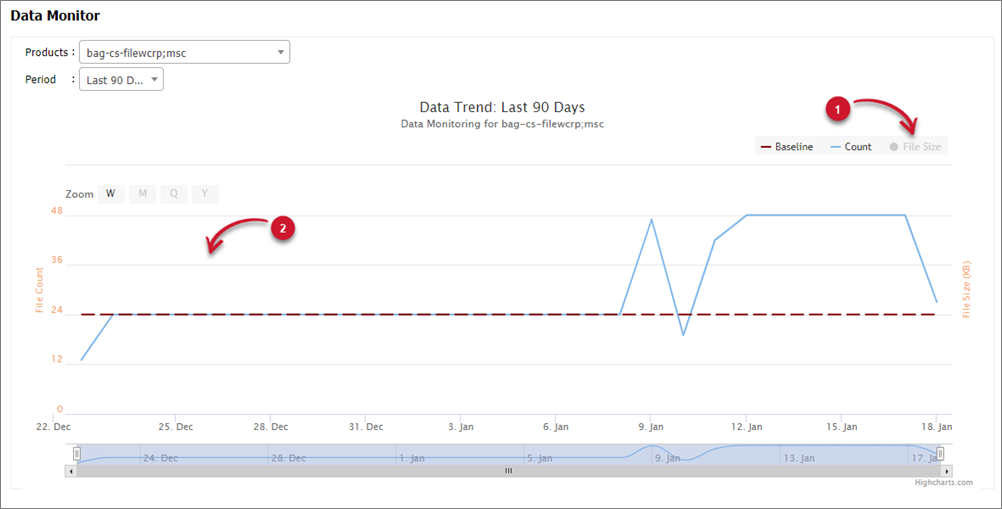
Hiding Measures in the Data Monitor Chart
In the Legend, click the name of the measure to hide.
The measure will disappear automatically in the chart.
#
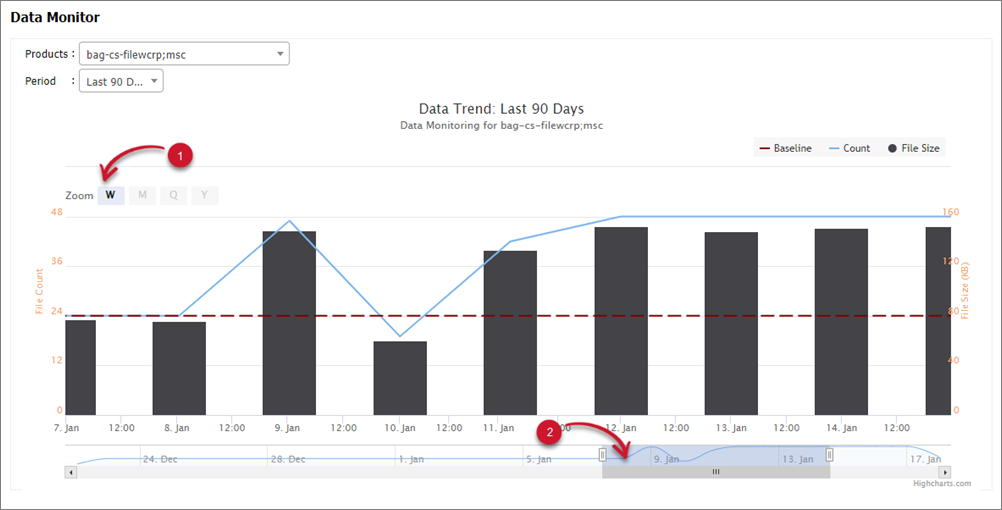
Navigating through Dates in the Data Monitor Chart
Click the desired date range in the Data Buckets.
W - Weekly
M - Monthly
Q - Quarterly
Y - Yearly
Drag the navigator to specific dates or date ranges to go to specific time frame.
#
Next Step?
After familiarizing with the Data Monitor Charts, you may proceed with configuring the Open iT Data Monitor and Alerts.
Configuring Open iT Data Monitor and Alerts