We’re upgrading your documentation experience!
A new doc website is live at docs.openit.cloud — a temporary preview during our transition. This website is now in maintenance-only mode (only critical issues will be addressed).
Explore the new website and send us your feedback!
#
Create and Add Report
The Create and Add Reports tab allows the user to use Analysis Server-like reports without Analysis Server installation. It also connects directly to the Core Server flat data files for report creation to avoid loading a massive amount of data in the SQL server, which may cause delay.
Before proceeding, make sure the Create and Add Report page is activated.
#
Uploading Reports
Report package upload only supports zip files. The zip file must contain a Streamlit Python script, a JSON file for metadata, and an executable for generating a data source of the report.
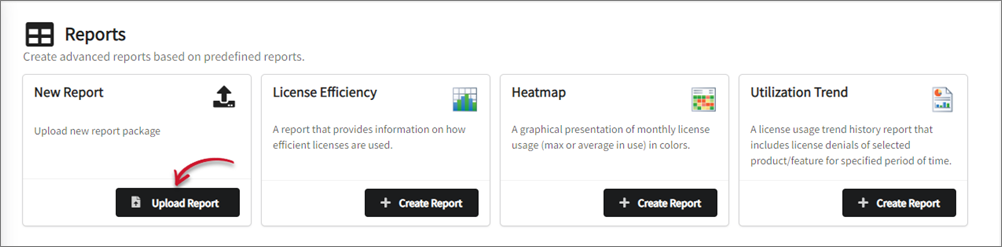
Go to Reporting > Create and Add Reports.
Click Upload Report.
 Core Server: Upload Report
Select the zip file to upload.
Wait for the page to finish processing. The page will extract and move files to their respective directories, and the report will then be included in the list.
Uploading a new report adds a new executable binary in the queries directory, which is by default in
C:\ProgramData\OpeniT\Data\querieson Windows and in your defined data-dir upon installation on Unix. This also creates a Python script and metadata in the streamlit directory, which is by default inC:\ProgramData\OpeniT\Data\streamliton Windows and in your defined data-dir upon installation on Unix.Manually move the new executable query from the streamlit directory to the queries directory in case it is not automatically moved after uploading.
#
Creating Reports
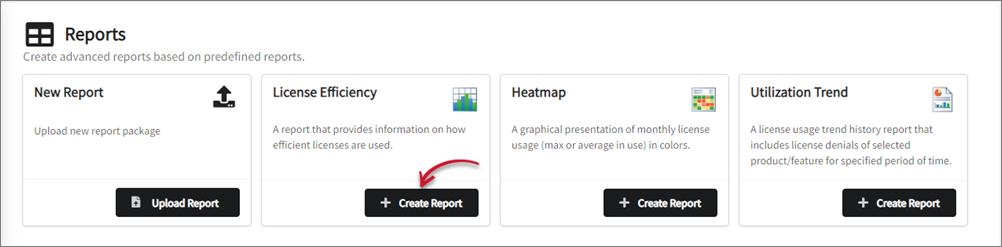
Go to Reporting > Create and Add Reports.
Click Create Report corresponding to the report to create. The page will redirect to Streamlit's web interface.
 Core Server: Create Report
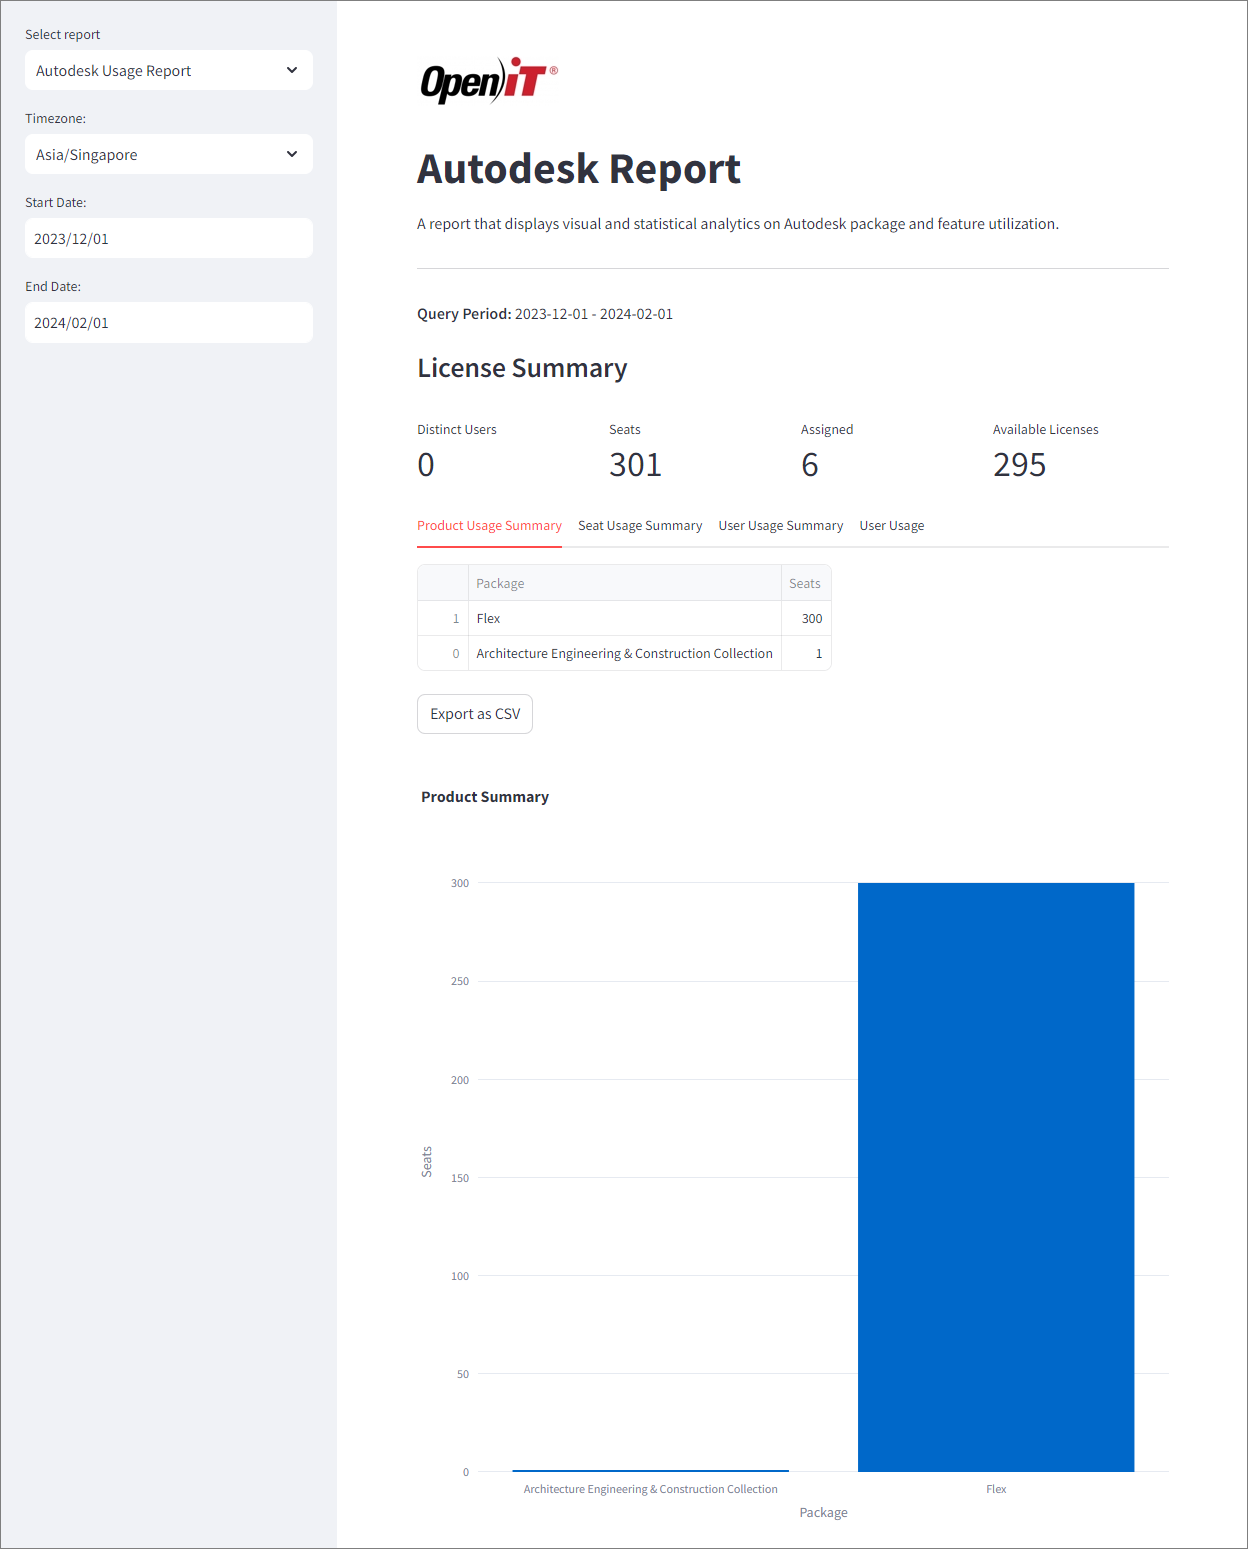
Autodesk Usage Report - This report displays the visual and statistical analytics on Autodesk package and feature utilization.
Make sure that the data types 94, 139, and 140 are available in the database.
 Core Server: Autodesk Usage Report
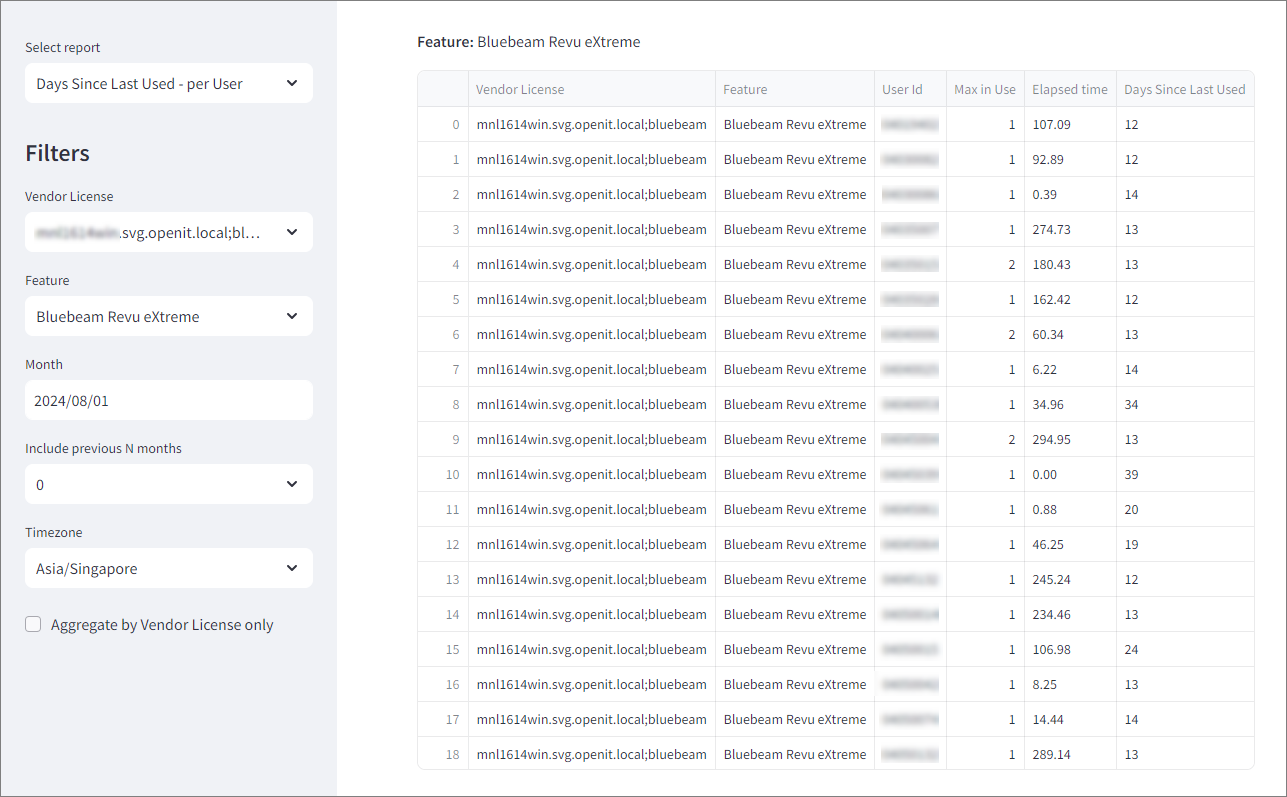
- Days Since Last Used - per User - This report is specifically for named user agreements presenting usage activity levels of the users of the selected applications.
 Core Server: Days Since Last Used - per User
- License Efficiency - A report on efficient license use. It also shows the utilization on max in use and max available licenses on specific percentiles, which is not readily available in the Core Server. By default, the selected percentiles are 1, 5, 50, 95, and 99. Select the percentile to show from the drop-down or click (x) beside the percentile number to remove it from the view.
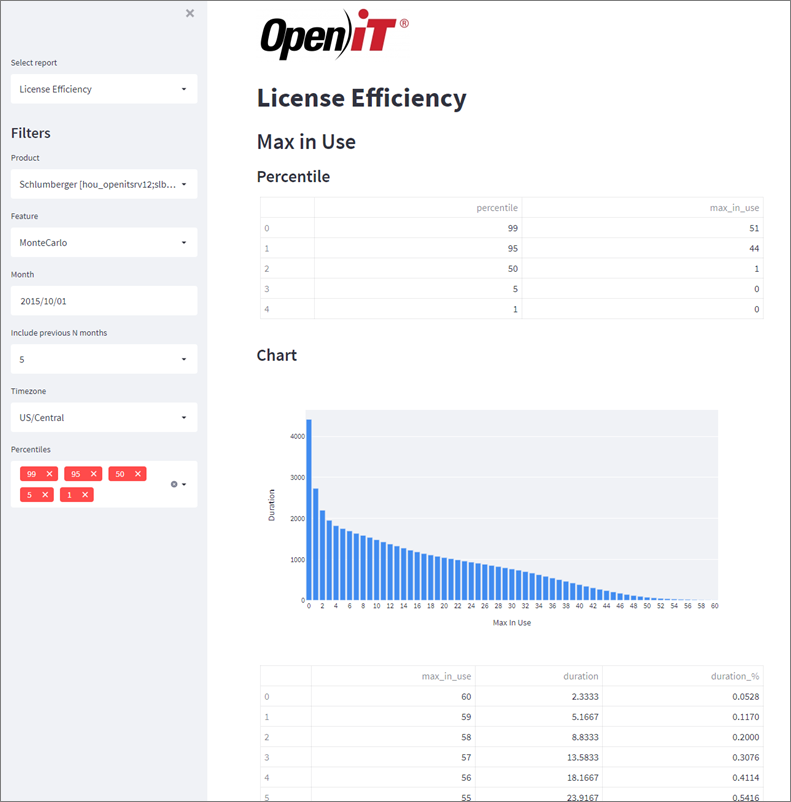 Core Server: License Efficiency Report
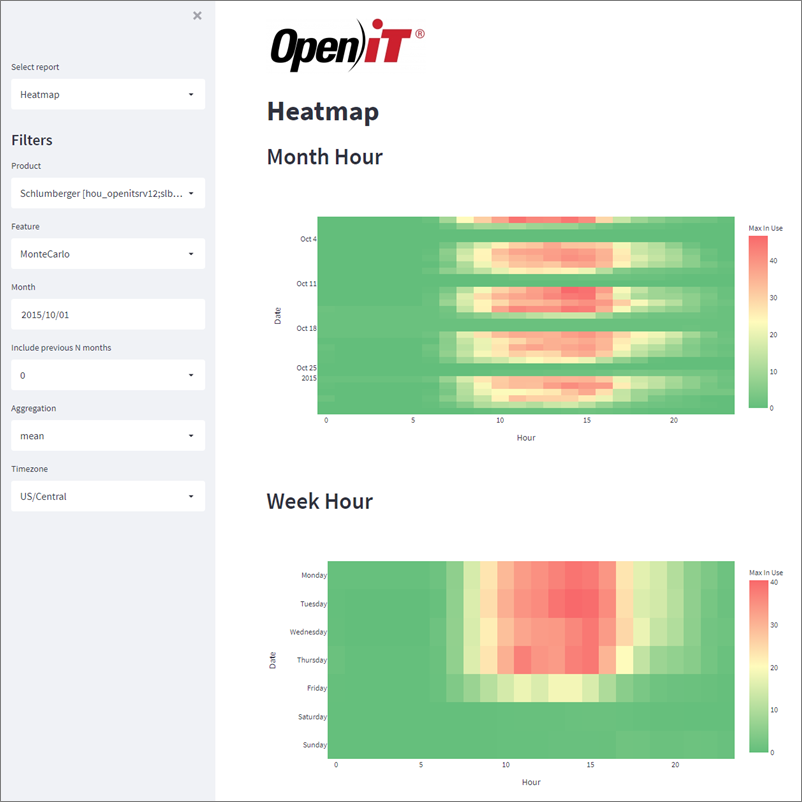
Heatmap - A graphical presentation of the monthly and weekly license usage reports (max or average in use) in colors of varying intensities. This report helps organizations with offices in different time zones monitor license usage. Select whether to show the mean or the max aggregation.
Make sure to select the correct time zone when generating Heatmap reports.
 Core Server: Heatmap Report
Impact Analysis - This report highlights the date and time that will be affected when the licenses are reduced based on License Efficiency calculation.
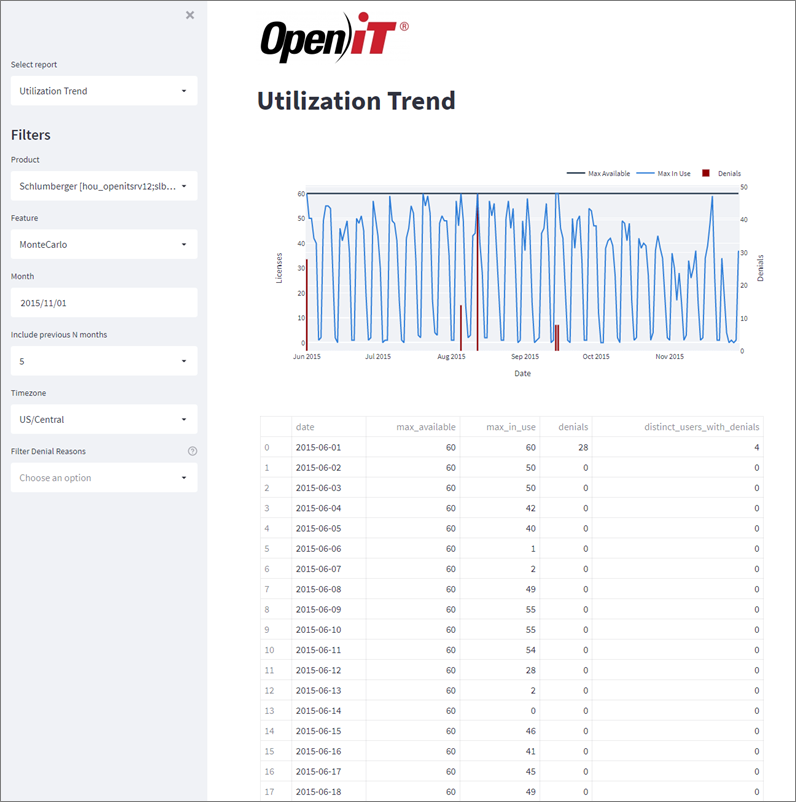
Utilization Trend - A license usage trend report that includes the license denials of a selected product/feature for a specified period.
It is best to have both data types 102 and 75 when creating Utilization Trend reports.
 Core Server: Utilization Trend Report
Select the filters. The GUI may load multiple times after selecting filters. Wait for the process to finish.
#
Getting Reports through API
On the Core Server web interface, go to Reporting > Create and Add Reports.
On the lower half of the page, select from the two options to get reports through the API:
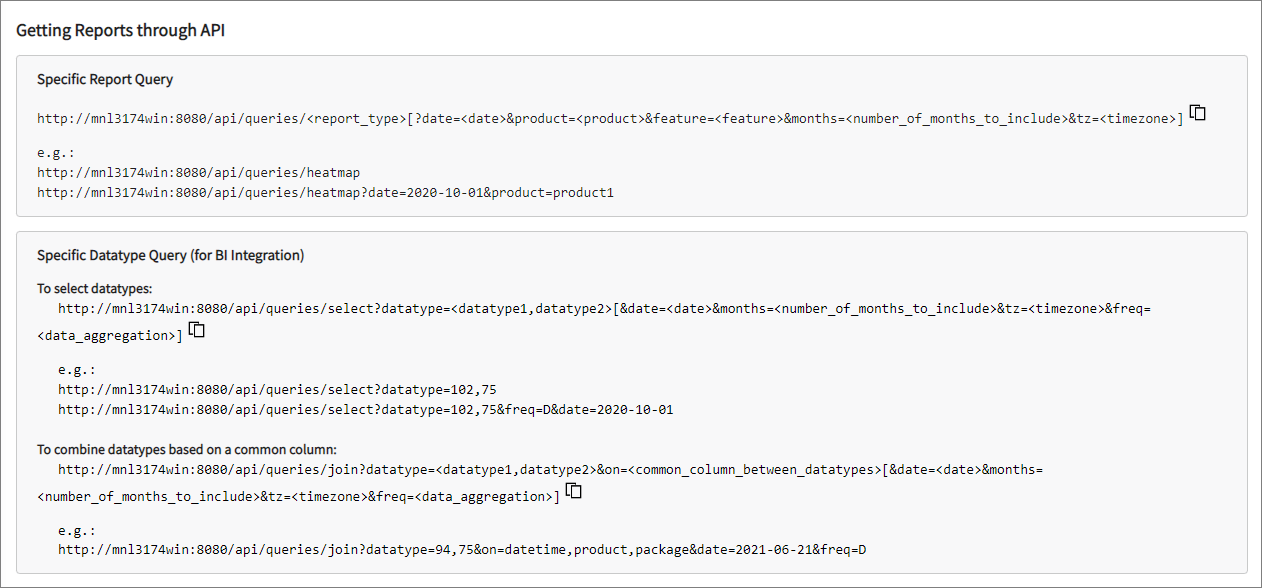
Specific Report Query
This query link specifies which report to generate. The link can include the specific report, or it can also include date (date), product (product), feature (feature), months (months), and timezone (tz) parameters.
The months parameter accepts an integer corresponding to the number of months to include in the report.
Use the following values for report type:
adsk - Autodesk Usage Report
dslu - Days Since Last Used - per user
efficiency - License Efficiency
heatmap - Heatmap
impact - Impact Analysis
utilization - Utilization Trend
Examplehttp://win-host01:8080/api/queries/heatmap?date=2022-10-01&product=product1A Heatmap report for Product1 on October 1, 2022 will be generated in this example.
Specific Datatype Query (for BI Integration)
There are two options for the data type query:
To select datatypes - selects the specific data type(s) to include in the report. This query can include data type(s), or it can also include date (date), months (months), timezone (tz), and frequency (freq) parameters.
To combine datatypes based on a common column - joins different data types based on their common column. This query can include data type(s) and the common column between the data types (on). It can also include date (date), months (months), timezone (tz), and frequency (freq) parameters.
The freq parameter accepts D (daily), M (monthly), or Y (yearly) value.
Examplehttp://win-host01:8080/api/queries/join?datatype=94,75&on=datetime,product,package&date=2021-06-21&freq=DThis example demonstrates how to generate a report by combining data from data types 94 and 75, using the date, product, and package information for June 21, 2021.
For further information about available data types and additional properties that can be utilized in this API, please refer to the Queries page.
To get the report in Excel, use the created URL and follow the steps provided in this link. For accessing the report in PowerBI, please refer to this link.