We’re upgrading your documentation experience!
A new doc website is live at docs.openit.cloud — a temporary preview during our transition. This website is now in maintenance-only mode (only critical issues will be addressed).
Explore the new website and send us your feedback!
#
Complete Selection
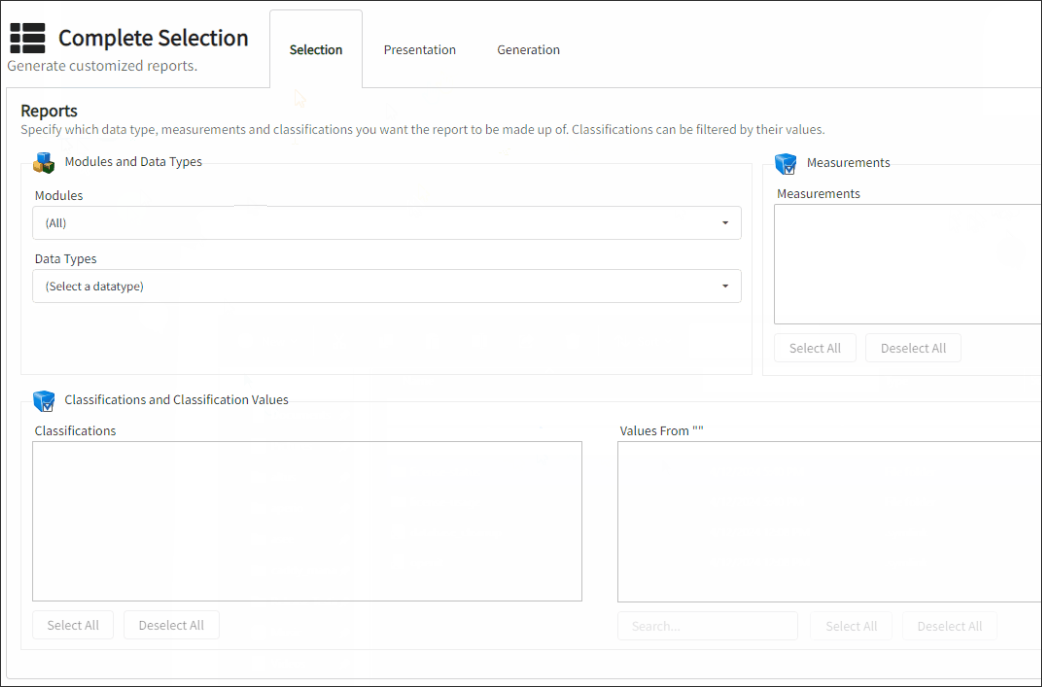
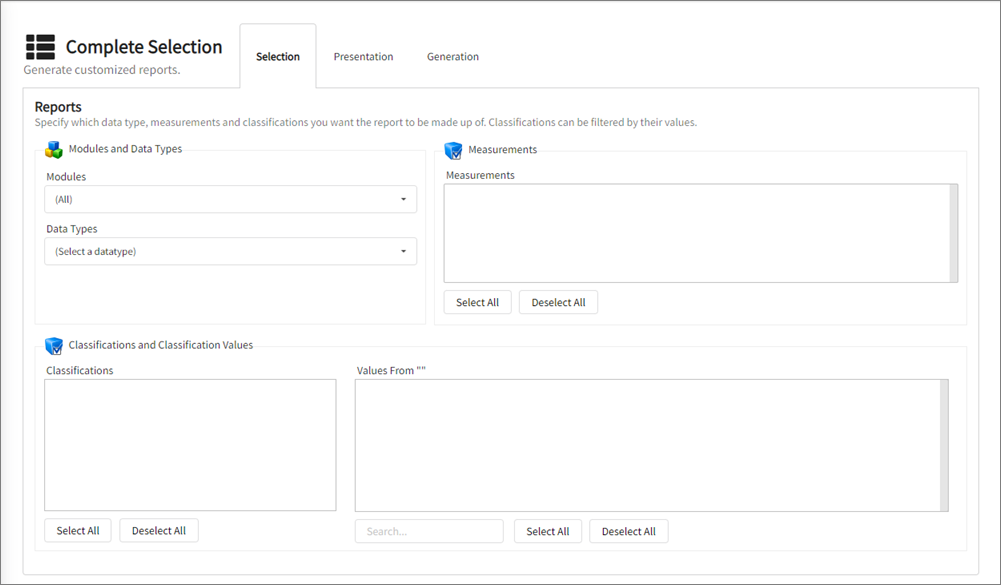
The Complete Selection tab allows the generation of reports involving a lengthy selection and presentation process. Advanced reporting with Complete Selection requires more insight into the details of the monitored resources and the structure of the reporting tool. Still, the advantage is that a report can be customized to suit specific requirements.
Upon selecting the Complete Selection tab, the Core Server may initiate database generation. Please wait until the Core Server finishes the database generation process, and the page will be automatically redirected to the Complete Selection page.
#
Selection Tab
Choose the information to report on this tab. It includes the following details:
Modules - the Open iT module
Data Types - the type of data to report
Measurements - the numerical values of the data
Classifications - the data categories and details
Classification Values - specific values of the selected classification
#
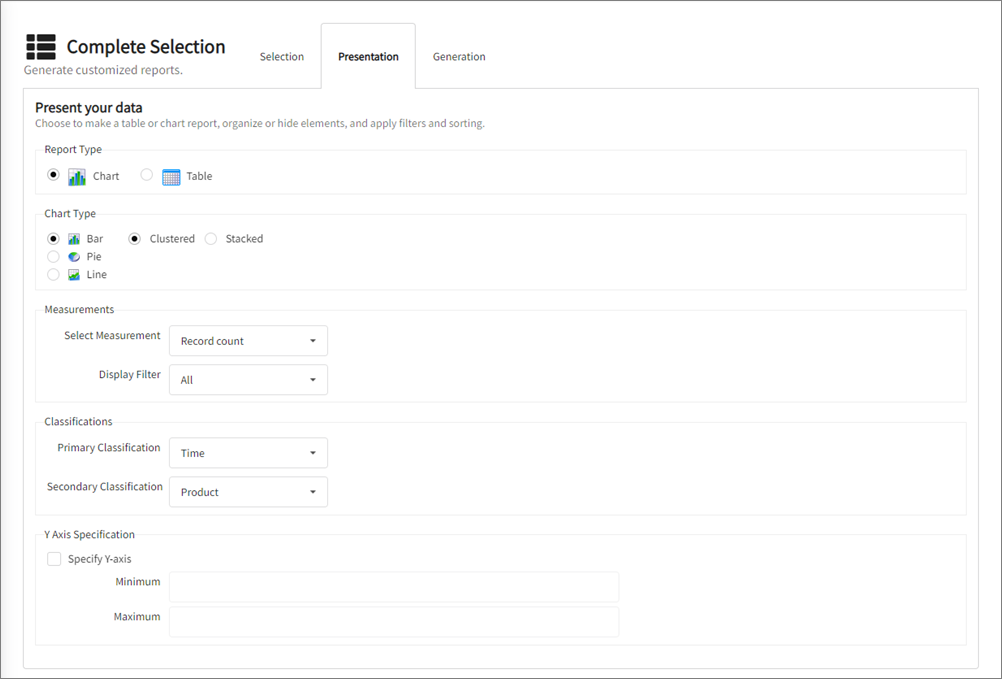
Presentation Tab
This tab contains options for customizing how the data is organized and presented in the report. It includes the following details:
Report Type - choose whether to present the report in a table or chart form
Chart Type - if the report type is a chart, choose the type of chart to create
Measurements - choose how to display the numerical values; could be filtered or sorted
Classifications - choose how to organize and arrange the classifications in the report
Y Axis Specification - if the report type is a chart, specify the minimum and maximum value for the y-axis
#
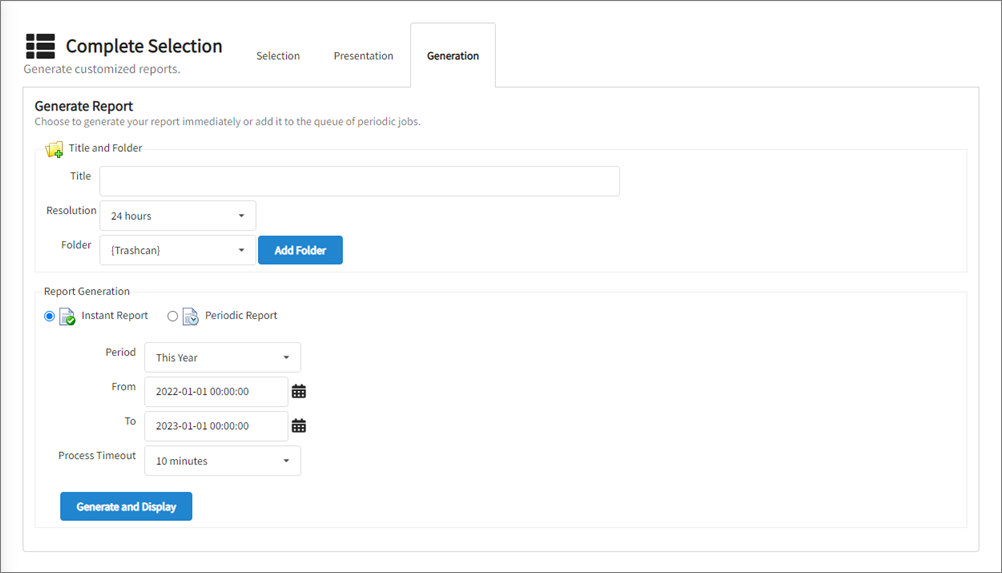
Generation Tab
This tab contains options to customize the report type, the location where to save the report, and the date range to include in the report.
Title and Folder - set a title for the report and select the folder where the report will be saved
Report Generation - specify whether the report will be periodic or instant, set the report period and the process timeout, then trigger the report generation
#
Creating Reports using the Complete Selection Tab
#
Data Selection
To select the information of the the report, follow these instructions:
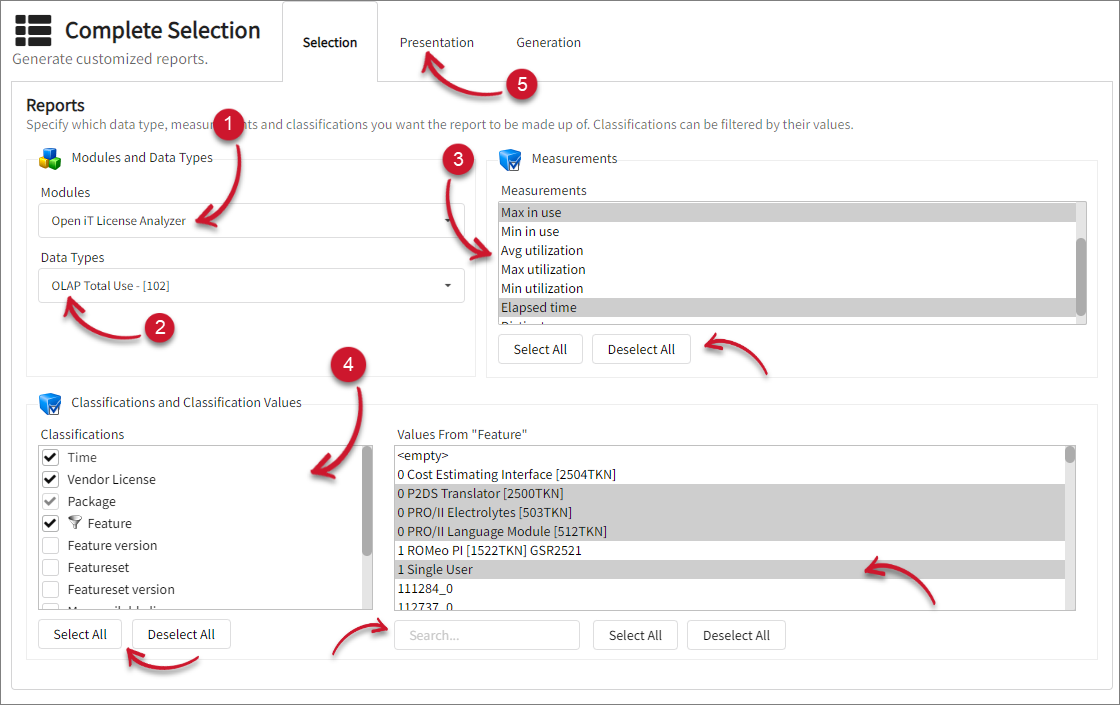
In the Modules drop-down list, choose the desired Open iT module to report. This is the type of Open iT collector that monitors specific system resource. This can be one of the following:
- Open iT ComputeAnalyzer
- Open iT LicenseAnalyzer Level 0
- Open iT LicenseAnalyzer Level 1
- Open iT LicenseAnalyzer Level 2
- Open iT StorageAnalyzer
In the Data Types drop-down list, choose the Open iT Data Type. This is filtered based on the selected item in Modules.
Choose among the available Measurements. The measurements shown are based on the selected data type.
Click the specific measurement to select a single item. If selecting multiple measurements, hold the Ctrl key and click the values. Use the Select All or Deselect All button to utilize the functionality.
Choose among the available Classifications. This is the data category and details in the report. Tick the checkbox associated with the desired classification.
When the Package classification is present, it is by default selected and cannot be deselected to display the report correctly.
When the classification is selected (except for Time), all the available specific values will show in the Classification Values pane. Use this to choose the necessary items for the report. Click the specific value to select a single item. If selecting multiple values, hold the Ctrl key and click the values.
Utilize the Search option below the Classification Values pane to further filter the displayed values and look for more specific value. Moreover, use the Select All or Deselect All button to utilize the functionality.
Once all details are final, click the Presentation tab beside the page title.
#
Report Presentation
There are two options for report presentation, table and chart.
#
Table Report Type
A tabular presentation of the selected data, and this is by default selected. To customize how the data is presented in the table, follow these instructions:
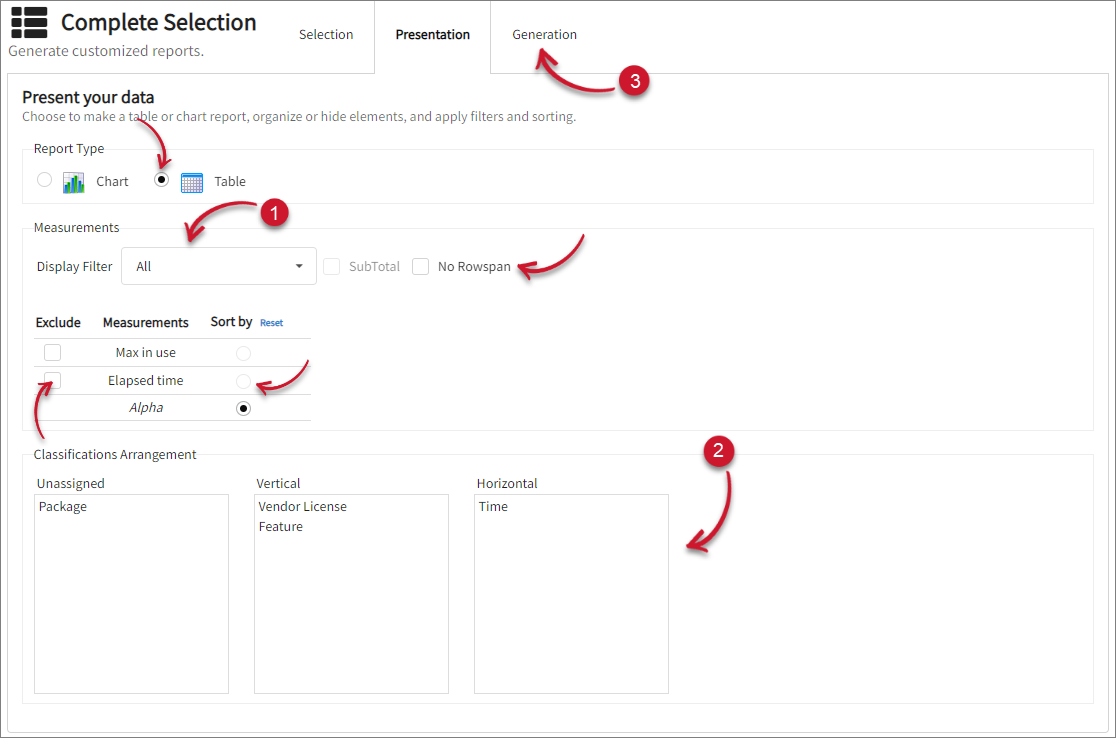
In the Measurements section, choose among the available Display Filter options and their associated options for additional filtering and sorting. Tick the checkbox associated with your selection.
Excluded measurements can still be used to sort through the report values.
 Report Presentation: Display Filter - All
- All - all the data will be reported. This is selected by default.
- Subtotal - shows the subtotal for each of the classification.
- No Rowspan - only displays cell-by-cell presentation in the table, no rowspan is implemented.
- Exclude - if the measure will be excluded in the report.
- Sort by - what measurement will the sorting be based on. The default is Alpha, which means that the classifications are sorted alphabetically.
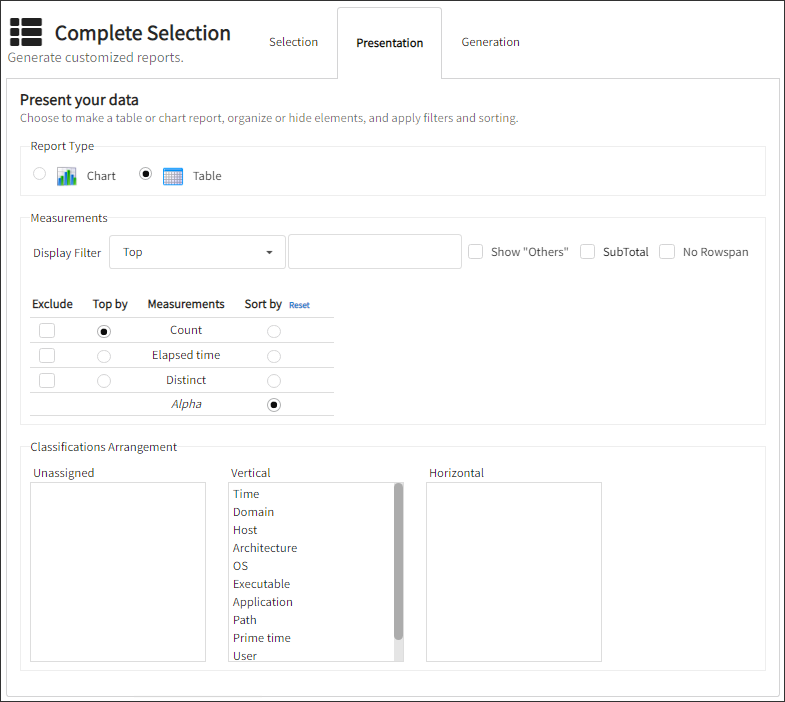 Report Presentation: Display Filter - Top
- Top - displays only the top x data that suffice the selected criteria. Provide the desired top number of items in the textbox.
- Show "Others" - shows other data that do not suffice the criteria.
- Subtotal - show the subtotal for each of the classification.
- No Rowspan - only displays cell-by-cell presentation in the table, no rowspan is implemented.
- Exclude - if the measure will be excluded in the report.
- Top by - the measurement on which the top criteria is based on. The default selected is the first measurement in the list.
- Sort by - what measurement will the sorting is based on. The default is Alpha which means that the classifications are sorted alphabetically.
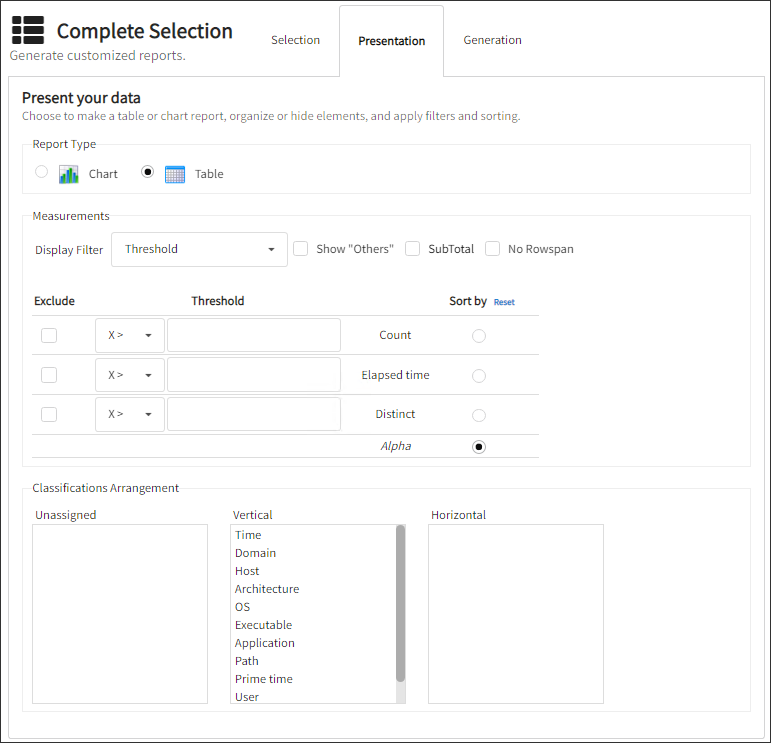 Report Presentation: Display Filter - Threshold
- Threshold - displays only the data that suffice the set threshold for each of the measurement.
- Show "Others" - shows other data that do not suffice the criteria.
- Subtotal - shows the subtotal for each of the classification.
- No Rowspan - only displays cell-by-cell presentation in the table, no rowspan is implemented.
- Exclude - if the measure will be excluded in the report.
- Threshold - for each of the measurement select among the available criteria, will it be (
>) greater than, (>=) greater than or equal, (=) equal, (<=) less than or equal, (<) less than or (<>) not equal. Then, provide the threshold value. - Sort by - what measurement will the sorting is based on. The default is Alpha which means that the classifications are sorted alphabetically.
- All - all the data will be reported. This is selected by default.
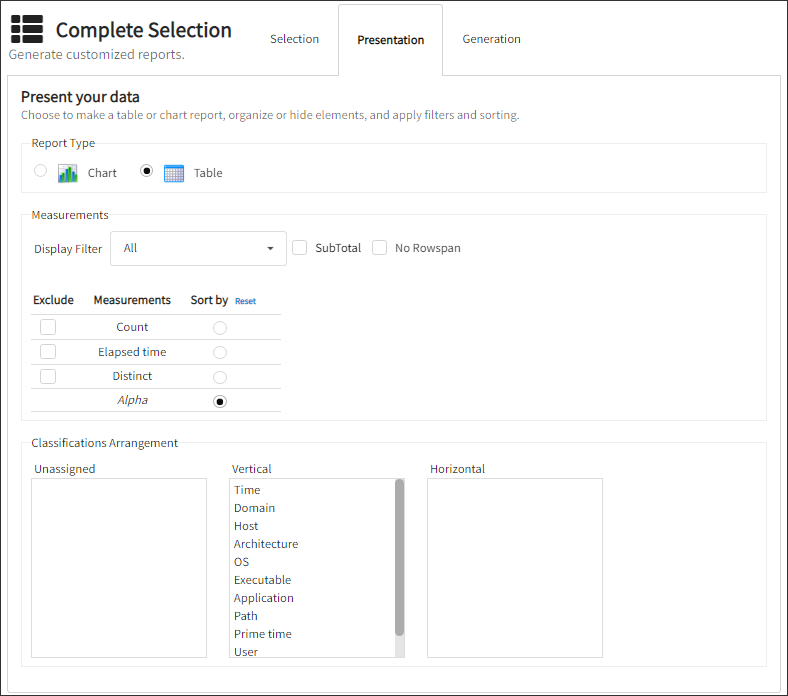
In the Classifications Arrangement section, drag and drop the classifications into the corresponding boxes to arrange their presentation order. All the classifications are placed in the Vertical layout by default.
- Unassigned - will not show the classification in the report but is regarded in the computation.
- Vertical - shows the data top-to-bottom in a column layout.
- Horizontal - shows the data left-to-right in a row layout.
Once all the details are final, click the Generation tab beside the page title.
#
Chart Report Type
A chart presentation of the selected data. To customize how the data is presented in the chart, follow these instructions:
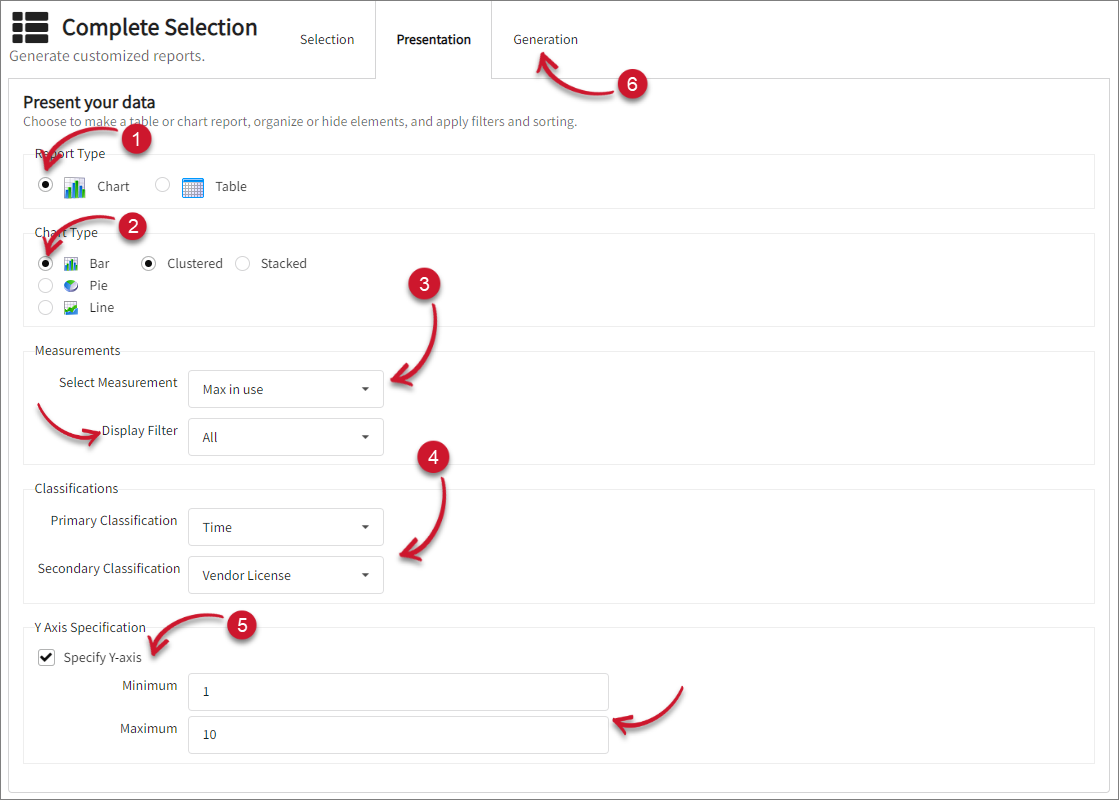
In the Report Type section, select Chart.
In the Chart Type section, choose among the available chart types - Bar (Clustered or Stacked), Pie or Line. Bar - Clustered chart is selected by default.
In the Measurements section, select the specific measurement to show in the chart. Select among the available Display Filter. Tick the checkbox associated with your selection.
- All - all the data will be reported. This is selected by default.
- Top - displays only the top x data based on the selected measurement. Provide the desired top number of items in the textbox.
- Show "Others" - shows other data that do not suffice the criteria.
- Threshold - displays only the data that suffice the set threshold for the selected measurement. Select among the available conditions, will it be (
>) greater than, (>=) greater than or equal, (=) equal, (<=) less than or equal, (<) less than or (<>) not equal. Then, provide the threshold value.- Show "Others" - shows other data that do not suffice the criteria.
In the Classifications section, select both the Primary and Secondary classifications. The Primary classification will be reported in X-Axis of the chart.
If specification of minimum and maximum values in the Y-Axis of the chart is necessary, use the Y-Axis Specification; otherwise, skip this step.
Tick the Specify Y-axis option and provide the Minimum and/or Maximum values for the Y-Axis.
Once all the details are final, click the Generation tab beside the page title.
#
Report Generation
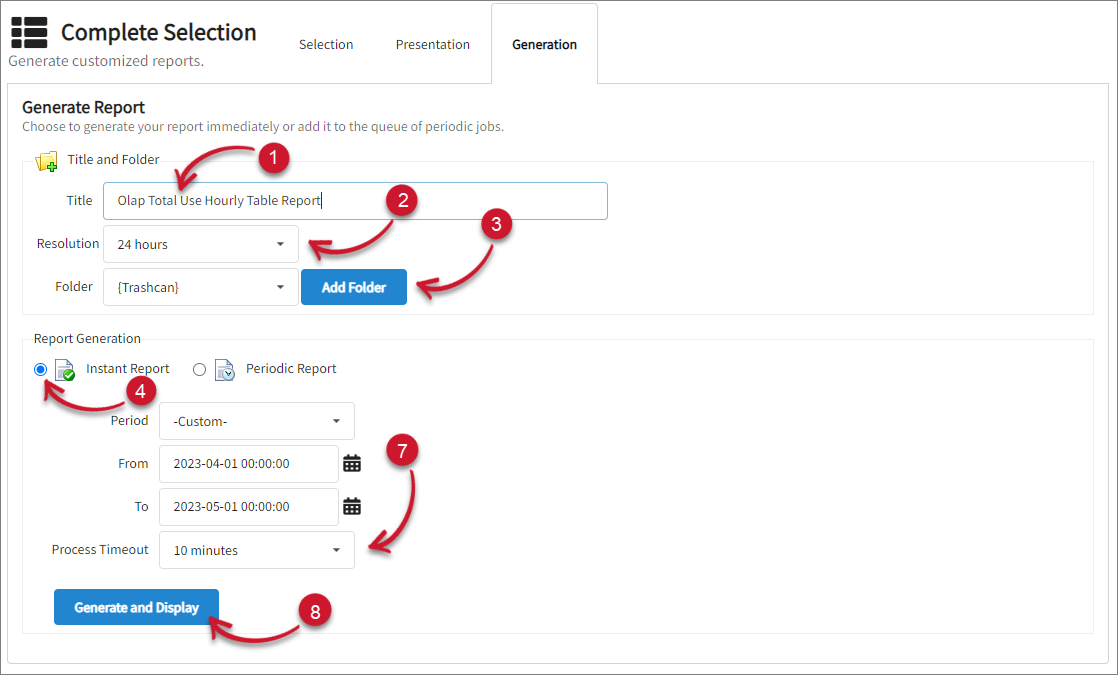
Type in a descriptive title for the report.
If the Time classification is selected, the Resolution option is available. Choose among the available values.
Choose where to save the report among the available folders:
- {Trashcan} - reports that are 24 hours old are automatically deleted every night.
- Demo - where the sample reports can be saved.
- Standard - where the standard periodic reports that come with the installation are stored.
- {Temporary} - stores reports for one week, and every night, files that are one week old are automatically deleted.
You may also add a new folder by following these steps:
Click Add Folder; a text box will appear.
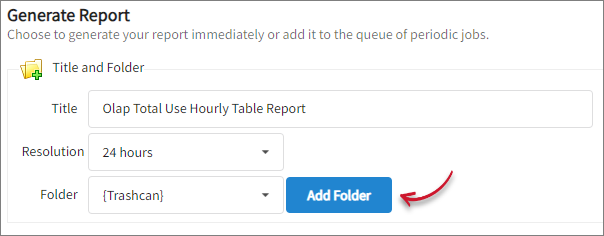 Complete Selection: Report Generation Add Folder
Type in the name of the folder.
Click Create. A prompt will appear to confirm the creation of the folder. Click OK.
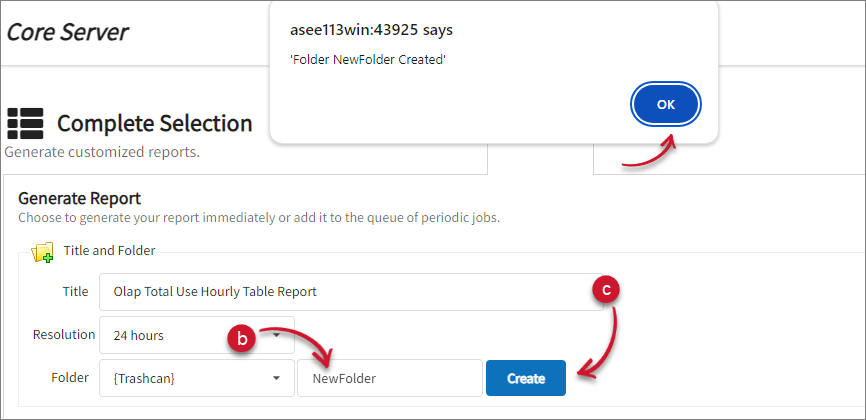 Complete Selection: Report Generation Create Folder
The newly created folder will be selected by default.
Select the report generation frequency:
Instant Report - generate the report immediately
Periodic Report - schedule the report generation
If instant report is selected, provide the date ranges to include in the report by following these instructions:
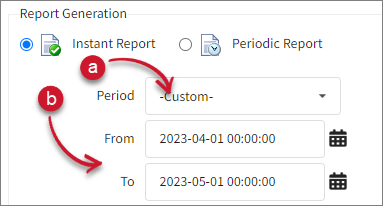 Complete Selection: Report Generation - Instant
Select among the available period. The From and To options are automatically updated based on the period selection.
If Custom is selected, provide a valid date range. Use the date picker to select dates easily.
Take a look at the status lines at the bottom of the web interface that displays a variety of process information, including periods of data availability.
If the periodic report is selected, provide the schedule of the report generation by following these instructions:
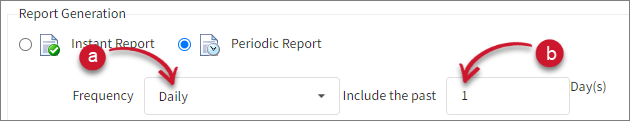 Complete Selection: Report Generation - Periodic
Choose among the available frequencies.
Provide the number of the chosen frequency to include in the Include the past option.
Choose the maximum waiting time for the report generation process by selecting from the available Process Timeout values.
The duration of report generation depends on the size of the chosen data. Choose a longer process timeout value or limit the data size in the Selection tab if an error occurs.
Click Generate and Display or Add to Queue of Periodic Jobs. The Status Message will show the status of the report generation.
#
Data Resolution
When selecting the Resolution, keep in mind the period that has been chosen. If the period selected and the data resolution are equal, the report will not show the actual trends. Only if the period is longer than (and usually a multiple of) the data resolution selected will a trend report be apparent. The period will be split into parts, each having a time range equal to the data resolution selected.
For all resolutions, except 1 week, the periods must match, and the periods specified must be a multiple of the interval; this means that when selecting a resolution of 1 hour, the start and end times must be on the hour. When selecting a resolution of 24 hours, the start and end times must be midnight (00:00) on the given days.
With a resolution of 1 week, it is possible to give any valid input. If the start and end days do not correspond to the exact start of weeks, they are moved to the closest legal start and end period, i.e., the report will include any week with 4 or more days from the given period.
#
Avoiding Pitfalls and Incorrect Reports
Open iT integrates various kinds of data into one database. Users can access all of this data through a single user interface. While this is one of the unique features of the Open iT software, users need to know the nature of the various data types to create reports. Some data types are used to generate status reports, and others are used to create trend reports. Mistaking one for the other may produce unexpected results.
Although a report is not explicitly defined as a status or trend report, there is an obvious distinction between the two. A status report displays a set of data valid at a moment in time for an arbitrary period, while a trend report gives a perspective over time. A trend report is built from several status reports combined and classified by time.
Open iT includes a mechanism to handle scenarios where data may be missing or incomplete to ensure the accuracy and reliability of reports generated from periodic jobs. When an existing periodic job is selected, the data availability for the job's data type is checked. If no data is found, an informative message will be displayed, explaining that the loaded data is missing or incomplete.
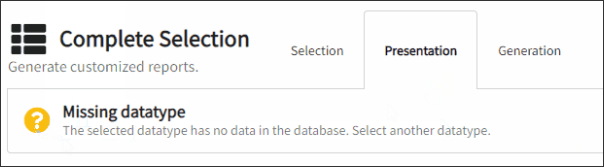
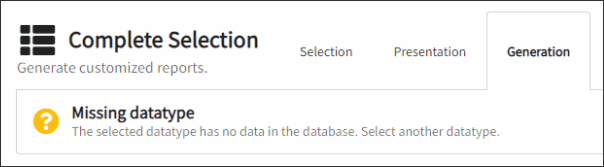
Additionally, controls that depend on the presence of data will be disabled to prevent any actions that could lead to inaccurate reports. This ensures that users are fully aware of the data status and helps maintain the integrity of the reports generated.