We’re upgrading your documentation experience!
A new doc website is live at docs.openit.cloud — a temporary preview during our transition. This website is now in maintenance-only mode (only critical issues will be addressed).
Explore the new website and send us your feedback!
#
Discovery
#
Using the Discovery Tool
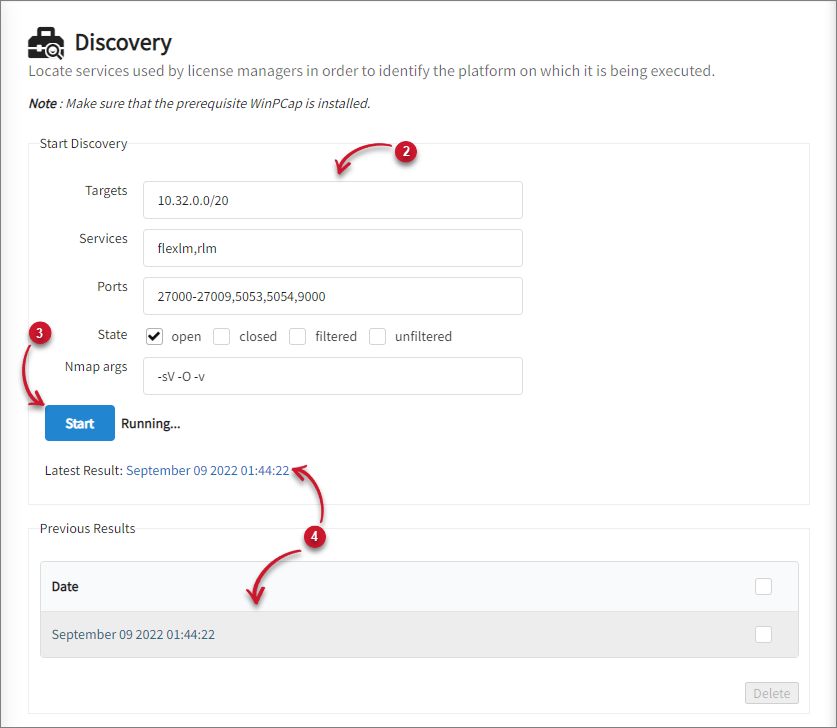
Go to Administration > Discovery.
Set up the configuration or use the default values.
Targets (required) - the list of target IP addresses or hostnames for scanning;
/<numbits>can be appended to an IPv4 address or hostname to scan a whole network of adjacent hosts; the targets can be separated by comma.Services (required) - the list of service names to discover, separated by comma
The
nmap-servicesfile contains the supported service names. This is located in the nmap folder under the bin directory of the discovery tool installation directory (i.e.,C:\Program Files\OpeniT\Core\ReportingServer\html\OpeniT\discoverytool\bin\nmap\).Ports (optional) - the ports to scan on every target; ports can be separated by comma while port ranges can be separated by a hyphen; if not specified, nmap scans the most common 1,000 ports for each protocol.
State (optional) - the state of the port of the service to discover; the following values are accepted:
open - means that an application on the target machine is listening for connections/packets on that port
closed - means that no application is listening on the port, though it could open up at any time
filtered - means that a firewall, filter, or other network obstacle is blocking the port so nmap cannot tell whether it is open or closed
unfiltered - means that the port is responsive to nmap probes but cannot be determined whether it is open or closed
Nmap args (optional) - nmap options to use in scanning the network; it is recommended to use the default value.
Click Start. A notification will appear beside the Start button if the scan is still running or already finished.
Click the link for the generated report beside the Latest Results.
A table of the Previous Results will be available for a historical view of the generated reports.
#
Discovery Tool Report
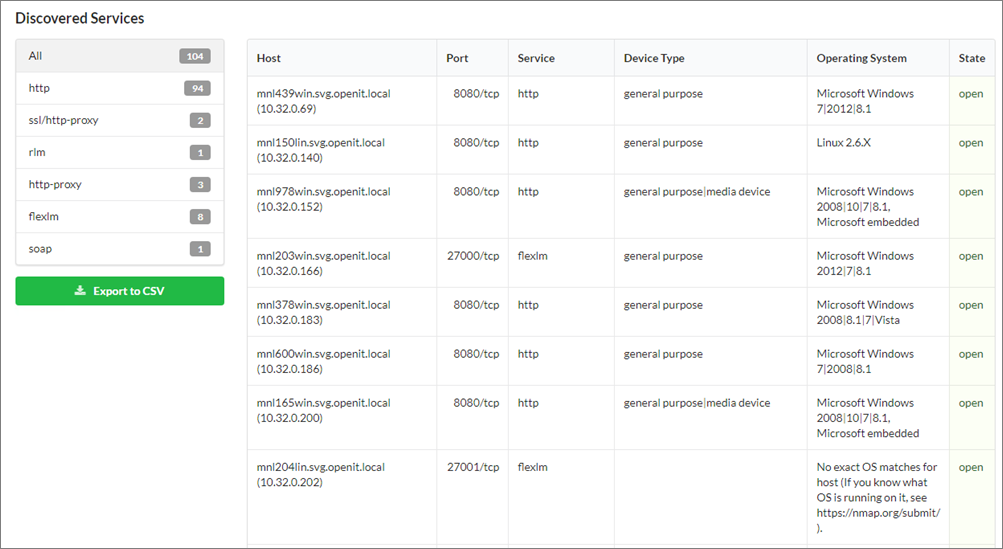
The report has two major parts, Scan Overview and Discovered Services.
- Scan Overview - This shows the targets and the total number of hosts for each target scanned by the tool.

- Discovered Services - This shows the report of the services discovered by the tool. On the left side is the summary of the discovered services and a button to export data. On the right side is the table containing the details where the services are running.