We’re upgrading your documentation experience!
A new doc website is live at docs.openit.cloud — a temporary preview during our transition. This website is now in maintenance-only mode (only critical issues will be addressed).
Explore the new website and send us your feedback!
#
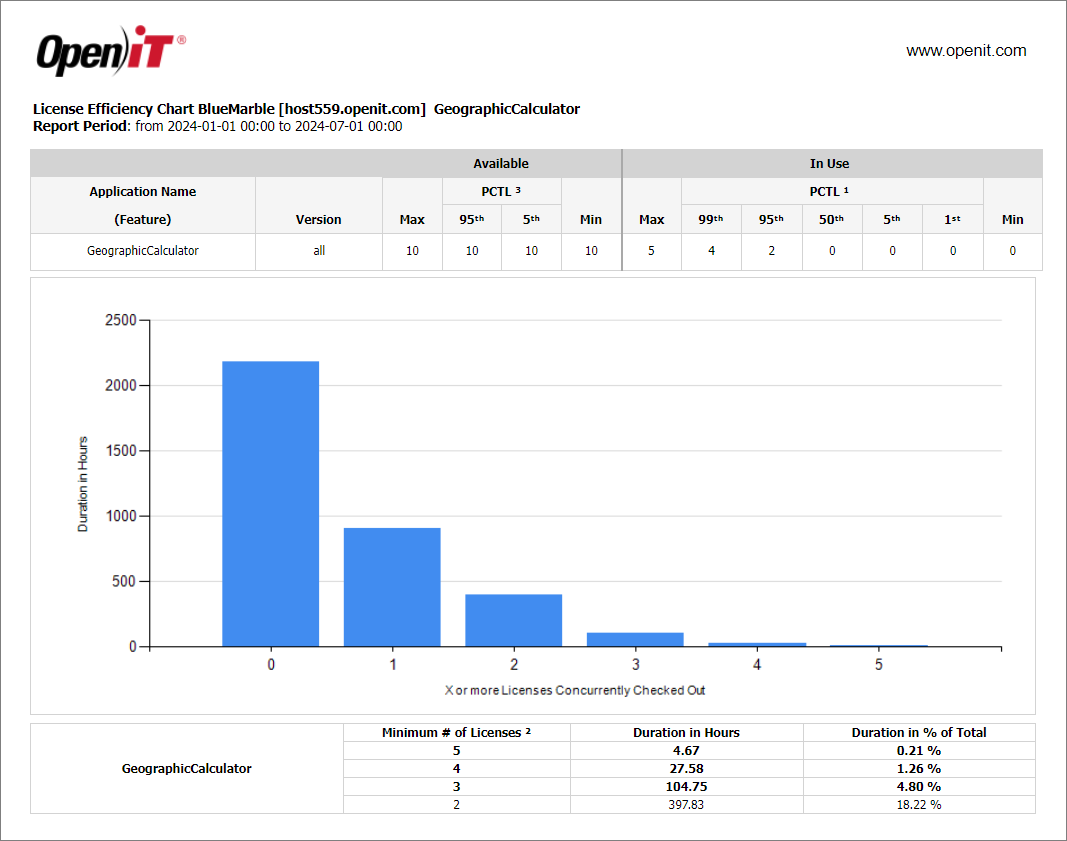
License Efficiency Chart - With Percentile
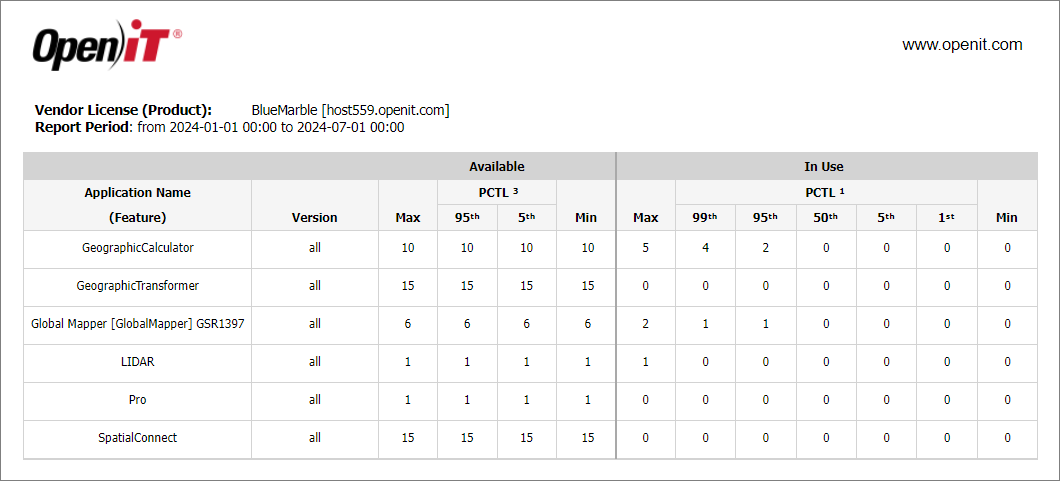
This report is an expanded version of the License Efficiency Chart, providing additional data such as the 99% and 95% Confidence Intervals and the Weekly Time Bucket reports. Including these details offers a more comprehensive overview of the licensing efficiency metrics and allows for a more thorough data analysis.
Follow these instructions to generate a report:
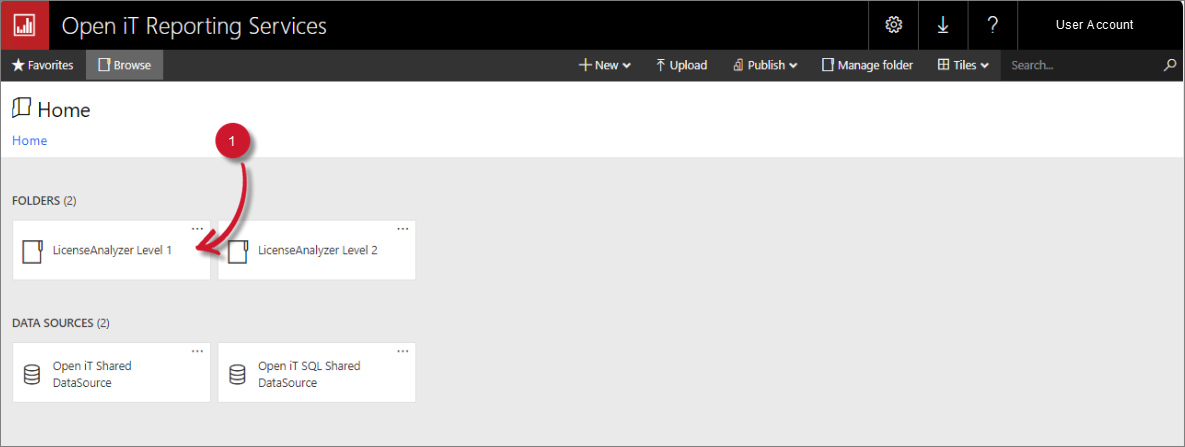
On the Open iT Reporting Services web portal home page, click on the LicenseAnalyzer Level 1 folder.
 LicenseAnalyzer Level 1 Folder
This will redirect you to the list of LicenseAnalyzer Level 1 report templates.
Click the License Efficiency - With Percentile report template.
Select the Application Type, Vendor License, Application Name, Zone, Time Year, Time Month, and Show All Version you want to include in the report.
 License Efficiency Chart - With Percentile Parameters
Parameters and Descriptions
Click the View Report button in the top-right corner of the report viewer. Wait for the report to generate. This may take a few minutes, depending on the size of the data.


Please see the Report Viewer Control Toolbar section for more details about its functionalities.

