We’re upgrading your documentation experience!
A new doc website is live at docs.openit.cloud — a temporary preview during our transition. This website is now in maintenance-only mode (only critical issues will be addressed).
Explore the new website and send us your feedback!
#
Home (Landing Page)
The Analysis Server Home page serves as the landing page of the web interface. It contains the overview of some of the important parts of the web interface.
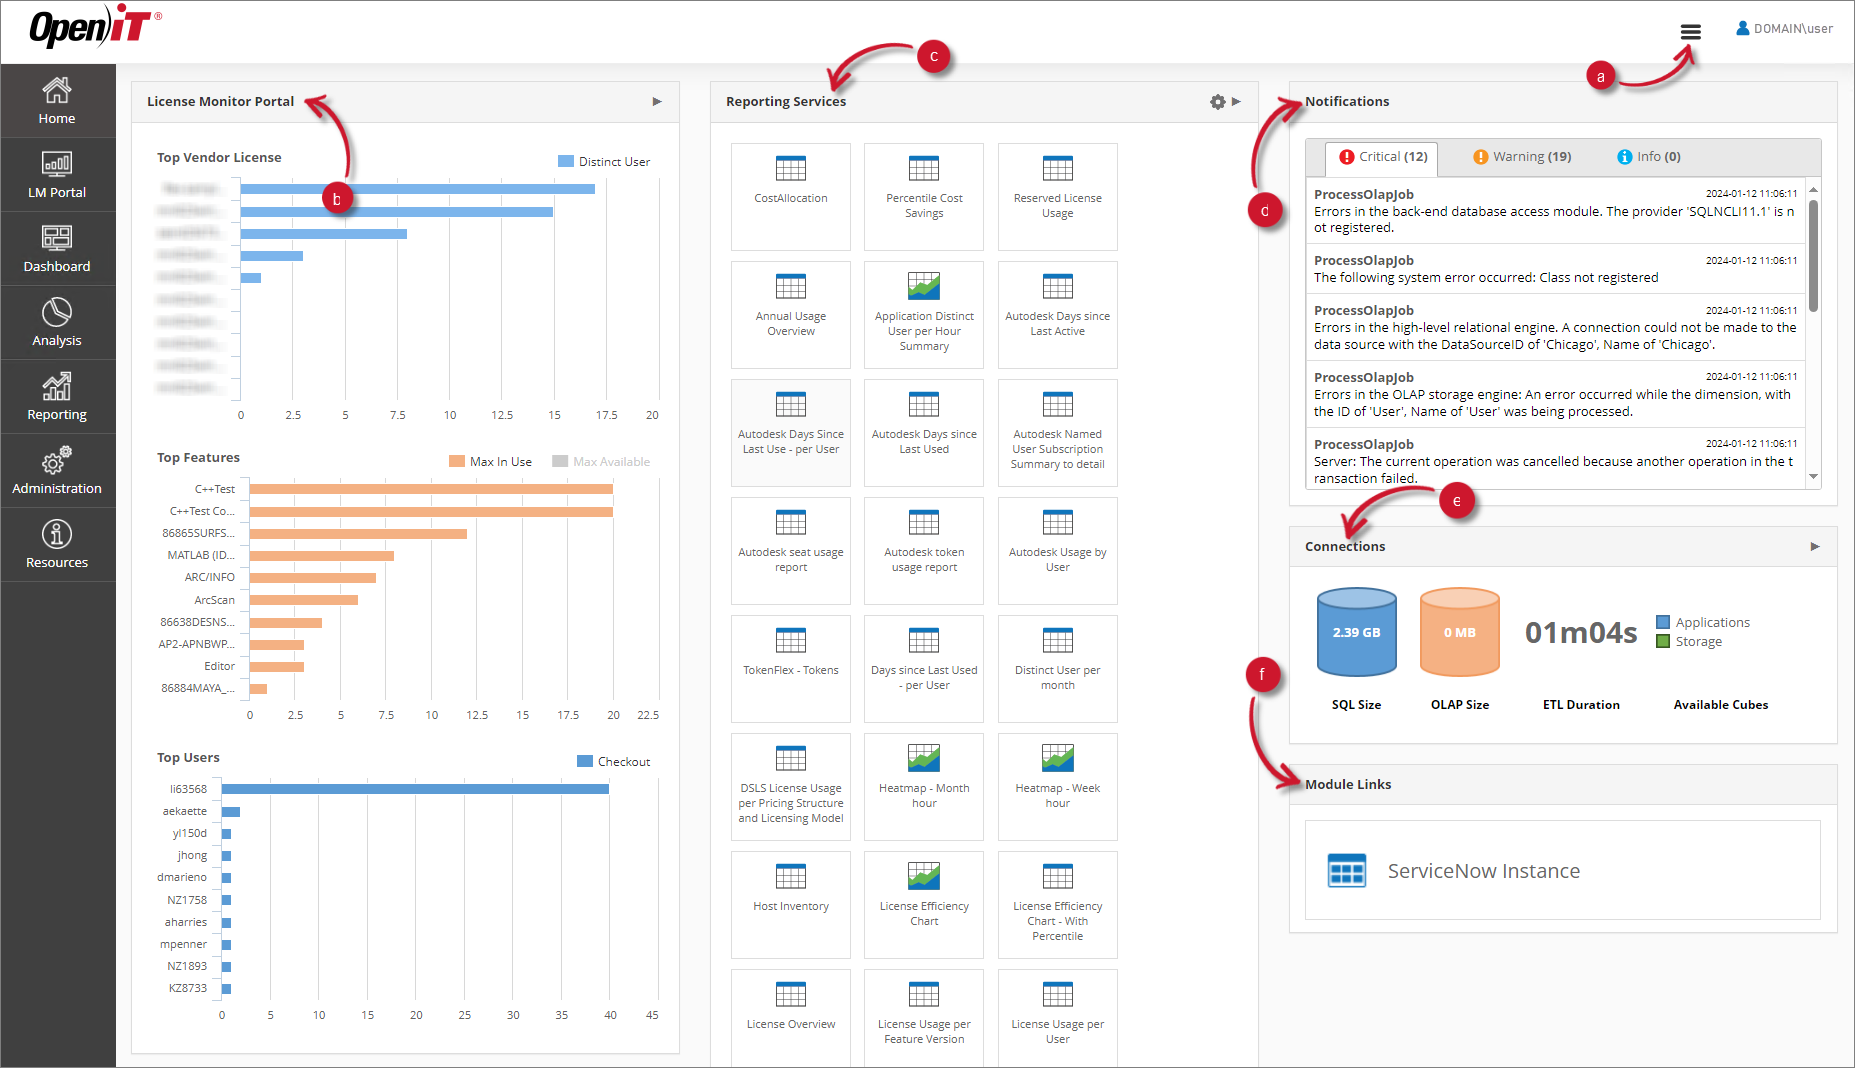
It contains the following parts:
Navigation Bar License Monitor Portal Reporting Services Notifications Connections Module Links
#
Navigation Bar
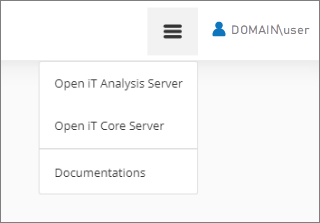
The Navigation Bar displays a list of connected Open iT services, such as Core Server, Analysis Server, CLIMS, Identity Server, Documentation, etc. The drop-down will only show the Open iT services connected to the user's Ingress set up. Clicking on any of them will redirect users to the landing page of the respective service.
The Navigation Bar is accessible only to users with Ingress installed, either locally or remotely.
#
License Monitor Portal
The License Monitor Portal panel contains an overview of the contents of the real-time monitor page.
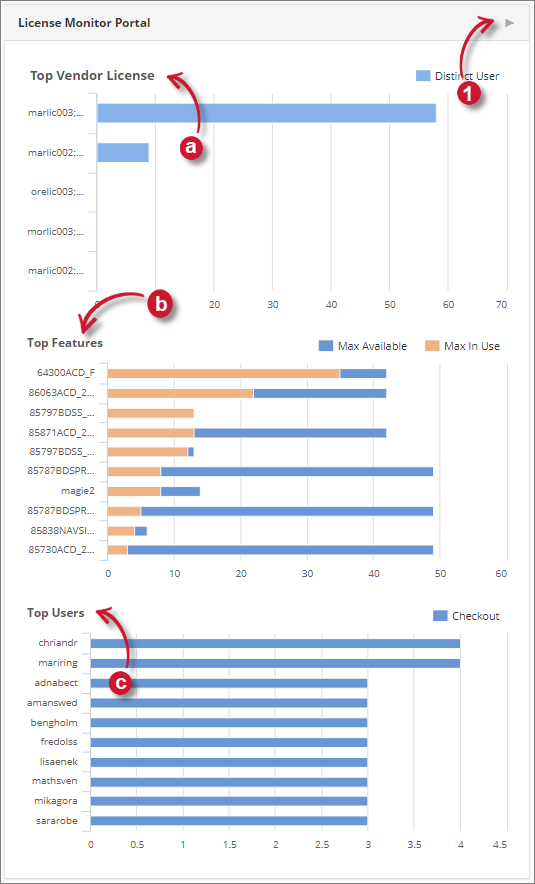
It consists of the following charts:
To use the shortcut functionality of the panel, (1) click the shortcut symbol () located at the upper-right corner of the License Monitor Portal panel. The page should be redirected to the License Monitor Portal page.
#
Reporting Services
The Reporting Services panel contains the list of Open iT Standard Report Templates. This panel is hidden by default, to show, follow the instructions in the guide Configuring Reporting Services Settings.
Accessing through Analysis Server with Single Sign-On will require and prompt for Windows Authentication.
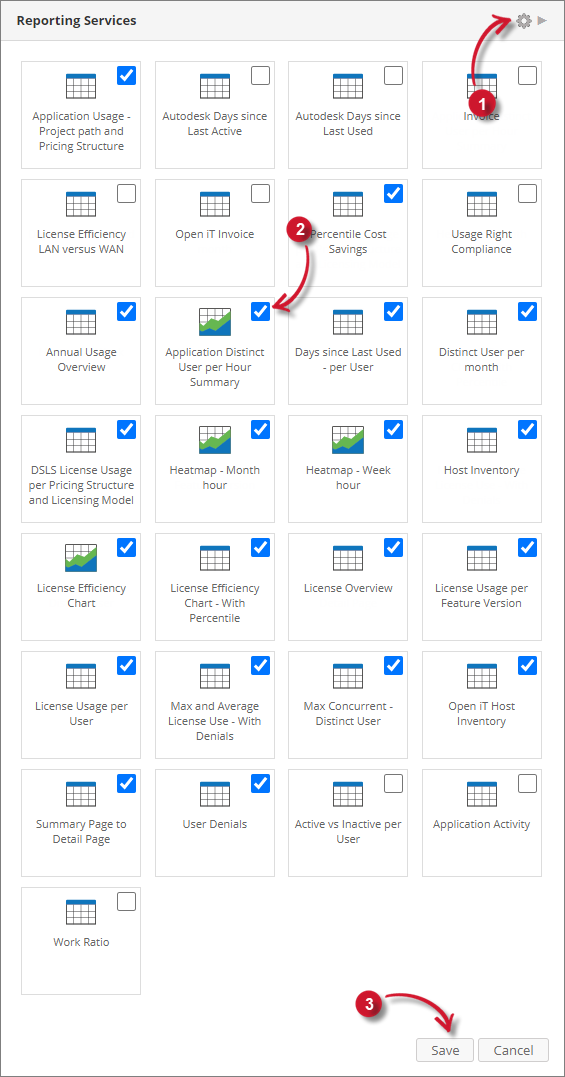
Follow these steps to use the functionalities of the panel:
Click the setting symbol () located at the upper-right corner of the Reporting Services panel.
Hidden report templates and checkbox for each of the item should appear at the same time.
Use the checkboxes to hide or show specific items.
Click Save to apply the changes.
Click the shortcut symbol () beside the settings symbol.
The page should be redirected to the Open iT Reporting Services portal.
#
Notifications
The Notifications panel contains the data processing logs categorized by severity. This in only visible to web user with Administrative access rights.
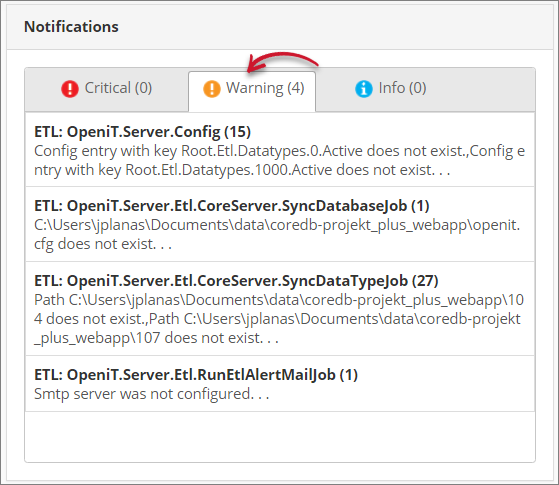
To use the functionality of the panel, click the specific tab headers desired to show. This should show the data processing logs useful for troubleshooting and monitoring. Click a specific item in the list and it should be redirected to the ETL Log page.
#
Connections
The Connections panel contains databases connection details and process status. This is only visible to web user with Administrative access rights.
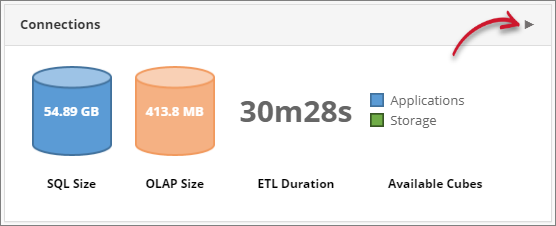
It has the following details:
- Sizes of the SQL and OLAP databases
- Total duration of the last successful data processing
- Available OLAP cubes
To use the shortcut functionality of the panel, click the shortcut symbol () located at the upper-right corner of the Connections panel. The page should be redirected to the Connections page.
#
Module Links
The Module Links panel contains configured external links.
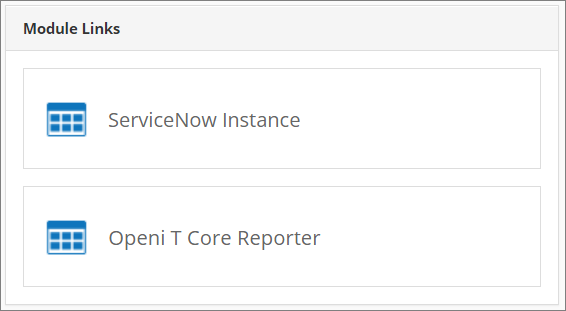
Follow these steps to add external links:
Open the command prompt and run the following command to go to the install directory of Analysis Server, which is by default
C:\Program Files\OpeniT\Analysis Server\.cd "C:\Program Files\OpeniT\Analysis Server\"Once in the directory, run the following command:
ExampleOpeniT.Server.Etl.Console.exe updateconfig Root.Web.ModuleLinks.[link_name] [valid_web_link]Where:
Module Link Command - Variables
ExampleOpeniT.Server.Etl.Console.exe updateconfig Root.Web.ModuleLinks.ServiceNowInstance https://sample.service-now.com/now/softwareasset/home/Wait until the process is finished.

