We’re upgrading your documentation experience!
A new doc website is live at docs.openit.cloud — a temporary preview during our transition. This website is now in maintenance-only mode (only critical issues will be addressed).
Explore the new website and send us your feedback!
#
Table View
This contains the interactive table for creating ad hoc reports.
#
Interactive Table
The interactive table gives the capabilities to the user to create ad hoc reports from the processed data. It has two main elements:
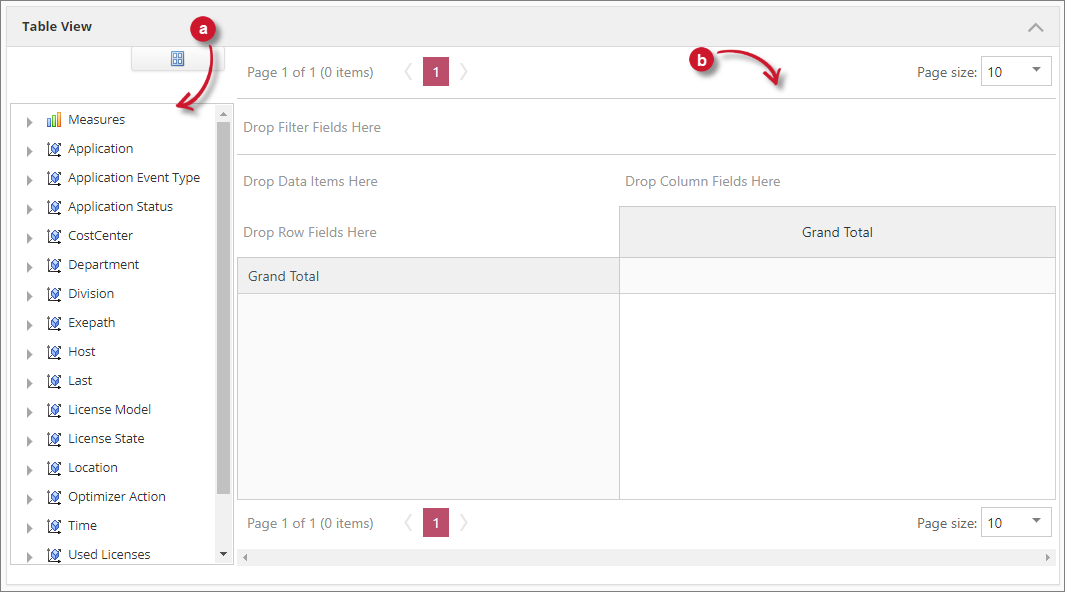
Field List - this contains Measures "Totals" and Classifications.Drop Area - an interactive area where users can drag and drop elements from the Field List to build a report.
#
Field List
The Field List contains all the information that can be reported in the interactive table. It has helpful layouts for certain situations.
Follow these instructions to switch to various layouts:
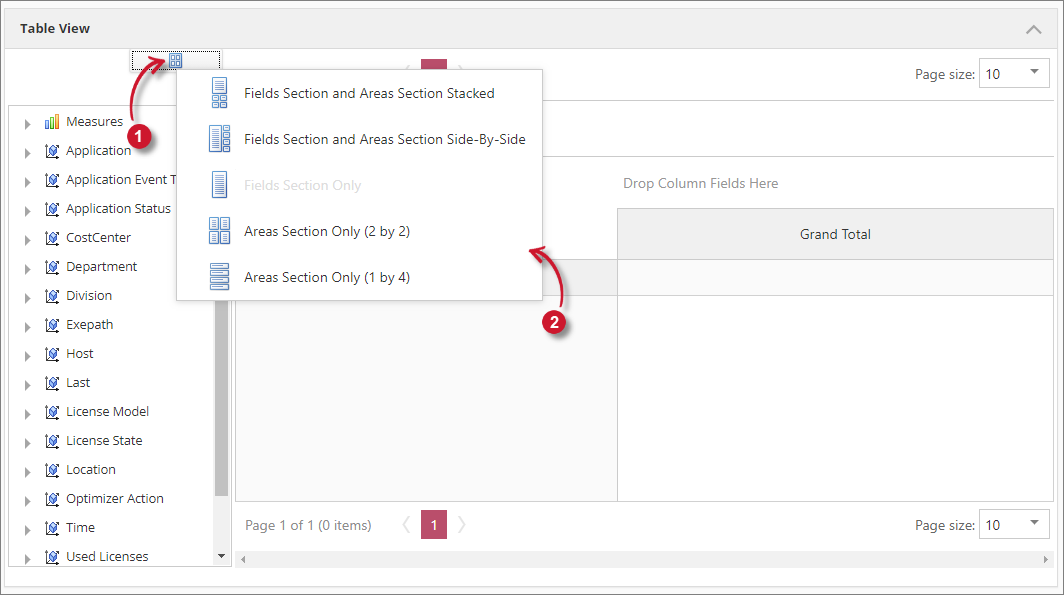
Click the Layout symbol above the Field List.
Choose among the available layouts as desired.
- Fields Section and Areas Section Stacked
- Field Section and Areas Section Side-By-Side
- Field Section Only (selected by default)
- Areas Section Only (2 by 2)
- Areas Section Only (1 by 4)
It should automatically apply the chosen layout in the Field List.
#
Drop Area
The Drop Area serves as the reporting pane. It contains various sections that accept specific elements from the Field List.
The following are the sections of the Drop Area:
Filter Section - accepts classifications for global filtering.
Data Item Section - accepts totals or measures.
Data Row section - accepts classifications for value segregation.
Column Field Section - accepts classifications for value segregation.
Value Section - displays the values of the measures in the Data Item Section.
#
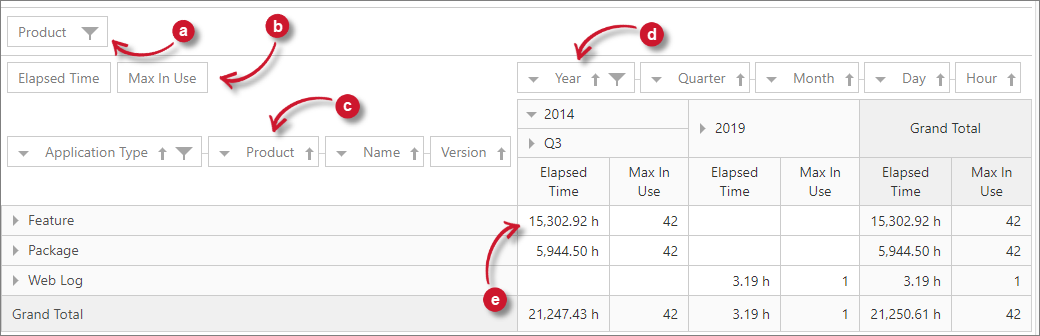
Reporting Basics
The reports contain measurements and classifications. Measurements are the numerical values while Classifications are the data categories. All the data in the reporting table is also in the Chart View. Every time an element is dragged in the reporting table, a chart element is also being added in the chart view. By default, the chart type is Line Chart.
#
Adding Elements
Follow these instructions to add one or more Measurements ("Totals") and Classifications to the table Drop Area.
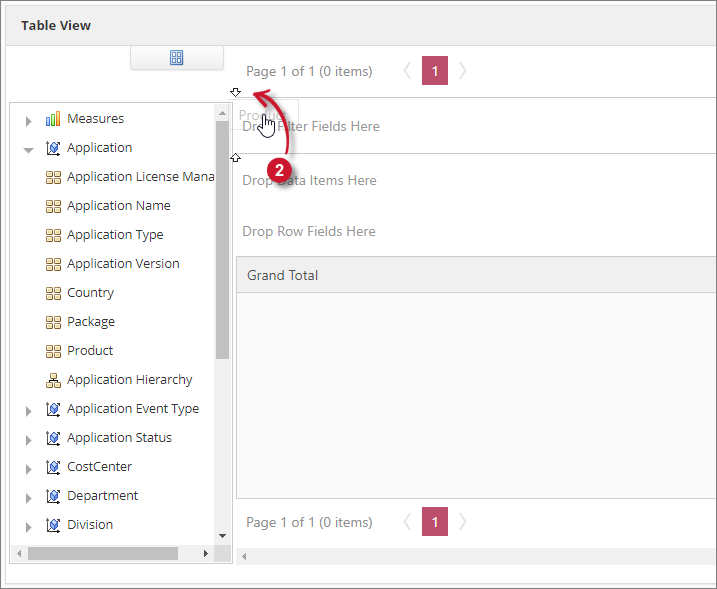
Select an element from the Field List and either drag it to the table Drop Area or in one of the options of the Area Section.
When the user drags an element into a field, the field will have two arrows pointing inward the field. This indicates that it accepts the element.
To move an element, simply drag and drop it onto its new place.
#
Removing Elements
Follow these instructions to remove one or more Measurements (“Totals”) and Classifications in the table Drop Area:
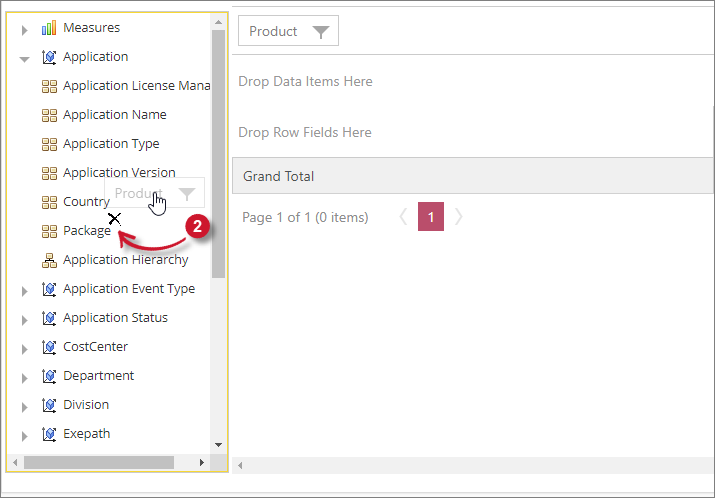
Drag the element from the Drop Area to the Field List.
When the user drags an element back into the field list, an X mark should appear beside the field. This indicates that it will remove the element.
Drop the element in the Field List and it should be removed from the data area.
#
Measurements
Measurements are the items under Measures in the Field List. These can only be placed in the Data Items Area. When a measure is placed, the value should appear in the totals area of the table.
Follow these instructions to add measures in the report:
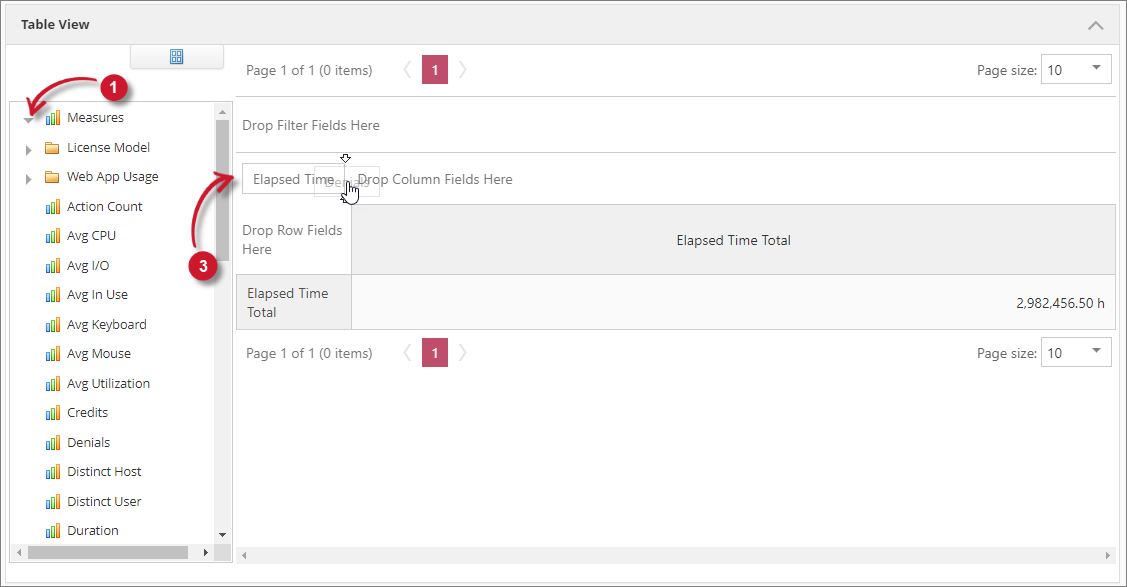
In the Field List, expand the Measures node. All the measures should be displayed.
Choose among the available measures.
Drag and drop the selected measure in the Data Items Area.
To add another measure, simply place it beside the currently reported measure.
#
Application Cube Measures
This is the list and description of all the available measures that can be reported in the Applications cube.
#
Storage Cube Measures
This is the list and description of all the available measures that can be reported in the Storage cube.
#
Classifications
The Classifications allow the user to specify how a user wanted to see the data. Expand the desired dimension to see the list of classifications under it. Furthermore, classifications can be added in the reporting table in three different ways: Row Items, Column Items, and Filter Items.
It is important that a measure or measures are in place when using classifications to successfully display the values of the selected classification.
#
Classifications as Row Item
Follow these instructions to add classifications as a row item:
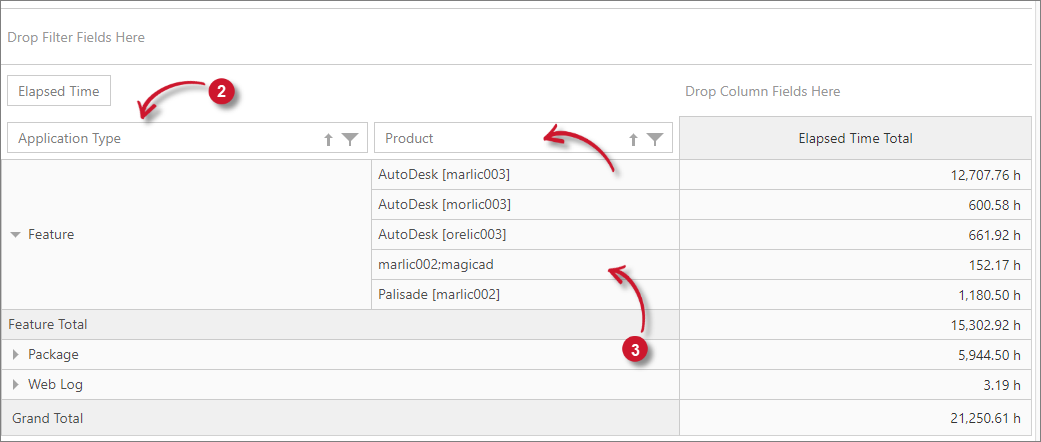
Drag the classification from the Field List.
Drop the classification in the row items area designated in the reporting table.
List values vertically together with the measures values in the reporting table.
It is also possible to add multiple classifications in the reporting table as row items. Simply drag and drop the desired classification beside the classification already in the reporting table. The classifications will then be in hierarchy having expand/collapse symbol for an organized reporting. Simply click this symbol () to see values of the classification added.
#
Classifications as Column Item
Follow these instructions to add classifications as a column item:
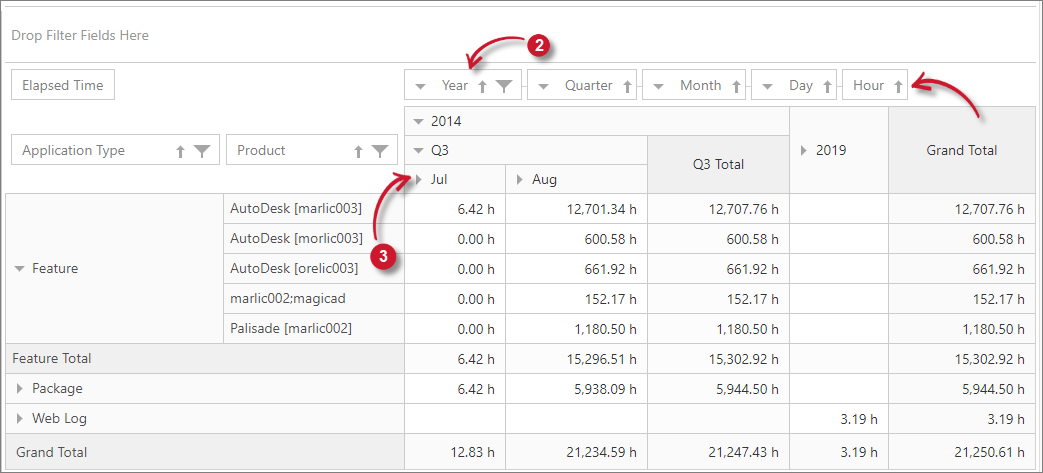
Drag the classification from the Field List.
Drop the classification in the column items area designated in the reporting table.
List values horizontally as column headers in the reporting table.
It is also possible to add multiple classifications in the reporting table as column items. Simply drag and drop the desired classification beside the classification already in the reporting table. The classifications will then be in hierarchy having expand/collapse symbol for an organized reporting. Simply click this symbol () to see values of the classification added.
#
Classifications as Filter Item
Follow these instructions to add classifications as a filter item that will filter what is already in the reporting table.
Drag the classification from the Field List.
Drop the classification in the Filter Items Area designated in the reporting table.
Click the Filter symbol in the right side of the classification. All values are selected by default.
Select a specific value under the selected classification.
Click OK and this should filter the classifications in the reporting table.
The procedure of adding multiple classifications as filter is the same as adding multiple items in row and column.
#
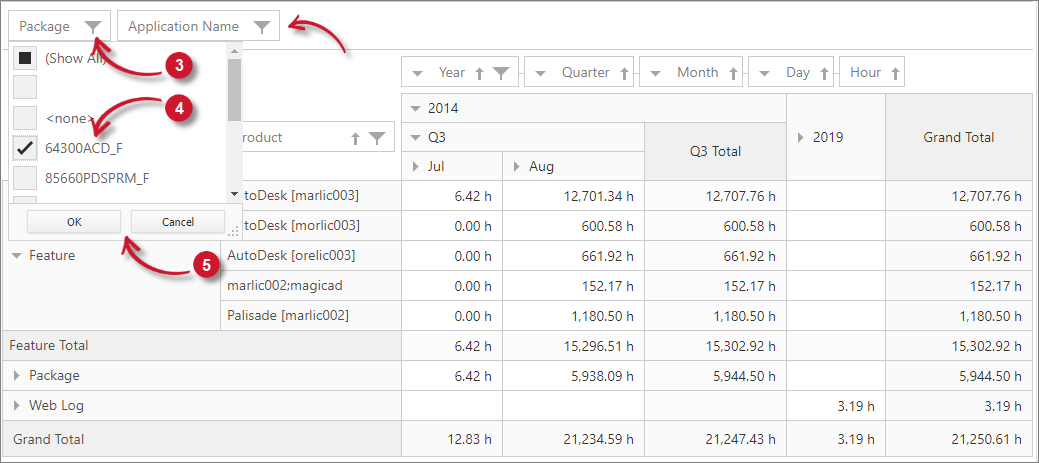
Filtering Classifications
Adding classifications as a filter items is considered as global filtering. It affects all the classifications in the reporting table. But it is also possible to filter the classifications solely, if it is necessary to further filter specific classification to get the needed report.
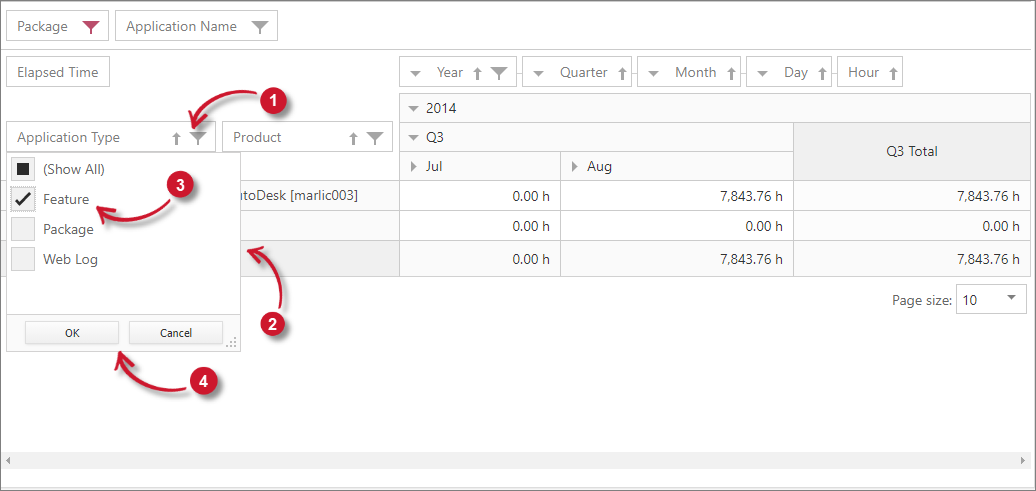
In order to do this:
Click the filter symbol in the right side of the corresponding classification.
List of values under the classification will appear. Uncheck all values by unchecking Show All option.
Choose desired values among the list.
Click OK to apply the changes.
This should filter the classification values in the reporting table.
This filtering can be done on each of the classification in the reporting table.
#
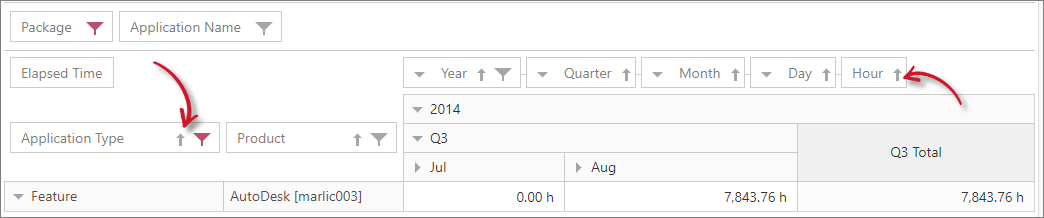
Sorting Classifications
Values in a classification are sorted in ascending alphabetically. Click the sorting symbol to invert the order.
#
Applications Cube Classifications
This is the list of all the available classifications and its descriptions in Applications cube.
Application Dimension
This dimension contains information of applications available in the data.
Application Event Type Dimension
This dimension contains information of various license events.
Application Status Dimension
This dimension contains details about the various application activity status.
Exepath Dimension
This dimension contains details about the specific path of the recorded executable.
Host Dimension
This dimension contains computer or machine information hosting the license.
Host Group Dimension
This dimension contains the host group information.
Last Dimension
This dimension includes filter values for time classification.
License Model
This dimension includes details about various licensing scheme.
License State Dimension
This dimension includes information about the various license statuses.
Optimizer Action Dimension
This dimension includes information about the various actions rendered during license harvesting.
Used Licenses Dimension
This dimension includes filter for the number of licenses used.
Web Information Dimension
This dimension includes various details about the recorded web applications.
#
Virtual Classifications
There are virtual predefined classifications generated by the Open iT client and are relatively static. It can act as a source of new virtual classification by using a mapping mechanism. The mapping has no restrictions. It only takes a source value and gives it a virtual value. Although the basic mapping is one-to-one, it is possible to map many-to-one (collapse), or one-to-many (split).
A typical scenario would be to automatically import this data from the organization's user directory. Analysis Server supports reading this data from a pre-prepared CSV file containing a current snapshot of the user data. The data loading component OpeniT.Server.Etl.Console.exe then keeps track of changing properties, such as whether a user changes email address, location or cost center. These changes will then be recorded in Analysis Server's database.
The reporting cube has predefined Classifications that are bound to user:
Cost Center Dimension
Department Dimension
Division Dimension
Location Dimension
User Dimension
This dimension includes various information about the current user of the license or application.
#
Time Classifications
A trend report shows usage over time. To present this in a graphical report, time classification must be included.
The time dimension includes the following classifications:
Time Buckets
Time Dimension
#
Storage Cube Classifications
This is the list of all the available classifications and its descriptions in Storage cube.
Domain Host Dimension
This dimension contains computer or machine information hosting the license.
Epoch Dimension
This dimension contains classification for Unix Time.
File Status Dimension
This dimension contains the classification for file statuses.
File System Dimension
This dimension contains the classification for file systems.
File Type Dimension
This dimension contains the classification for file types.
Last Dimension
This dimension includes filter values for time classification.
Measure Dimension
This dimension contains the classification that categorizes file systems.
Modify Temperature Dimension
This dimension contains the classification for file temperatures that categorizes its age of modification.
Read Temperature Dimension
TThis dimension contains the classification for file temperatures that categorize its age of last read.
#
Time Classifications
A trend report shows usage over time. To present this in a graphical report, time classification must be included.
To use the Time Dimension, please use its description in the section