We’re upgrading your documentation experience!
A new doc website is live at docs.openit.cloud — a temporary preview during our transition. This website is now in maintenance-only mode (only critical issues will be addressed).
Explore the new website and send us your feedback!
#
Chart View
This contains the interactive chart for visualizing reports created in the interactive table.
#
Interactive Chart
The Interactive Chart is based on the same concept as the Drop Area table. Choose from a variety of presentation formats, including Line, Bar, Pie and Area charts. The Drop Area chart is linked to the Interactive Table. Any changes made in either the Drop Area table or the Drop Area chart will be reflected in the other presentation. It has the following parts:
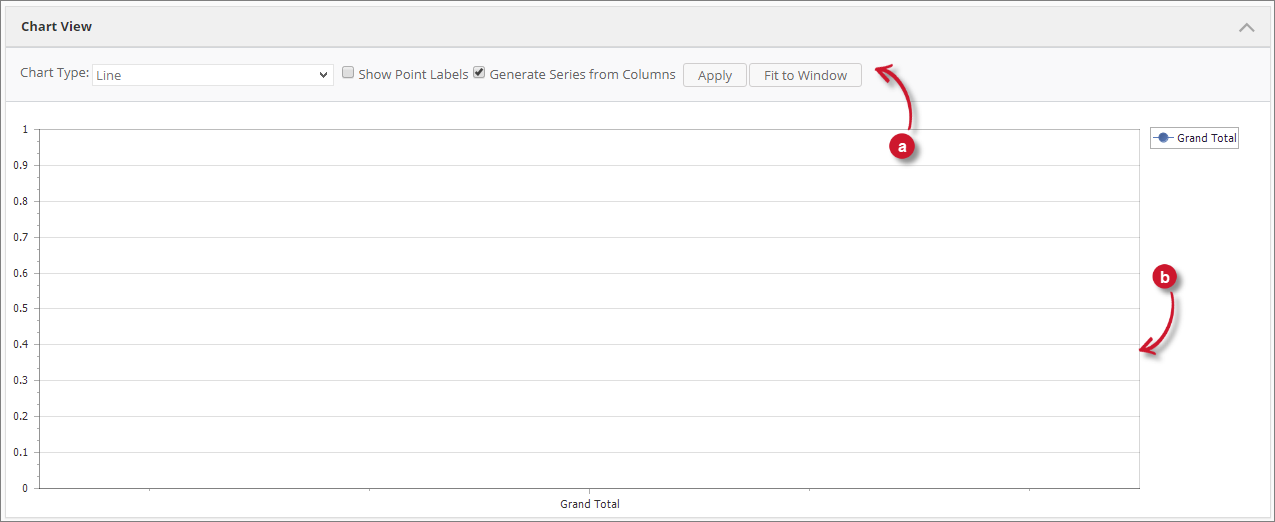
Chart Controls - this contains the various controls on how data is displayed in the chart.Chart Area -this contains the presentation of the chart.
#
Chart Controls
Follow these instructions to use the various chart controls:
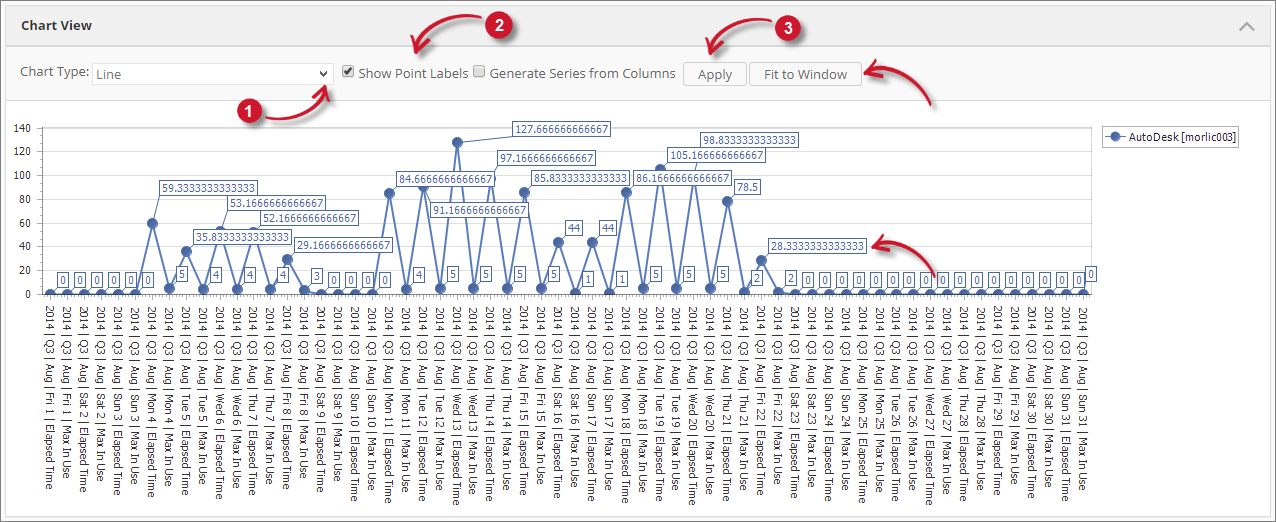
Choose among the Chart Type options. Line Chart is selected by default.
Tick for the following options to be applied in the chart.
Analysis Console: Interactive Chart ControlsClick the Apply button.
The interactive chart should be refreshed based on the provided chart control values.
#
Chart Area
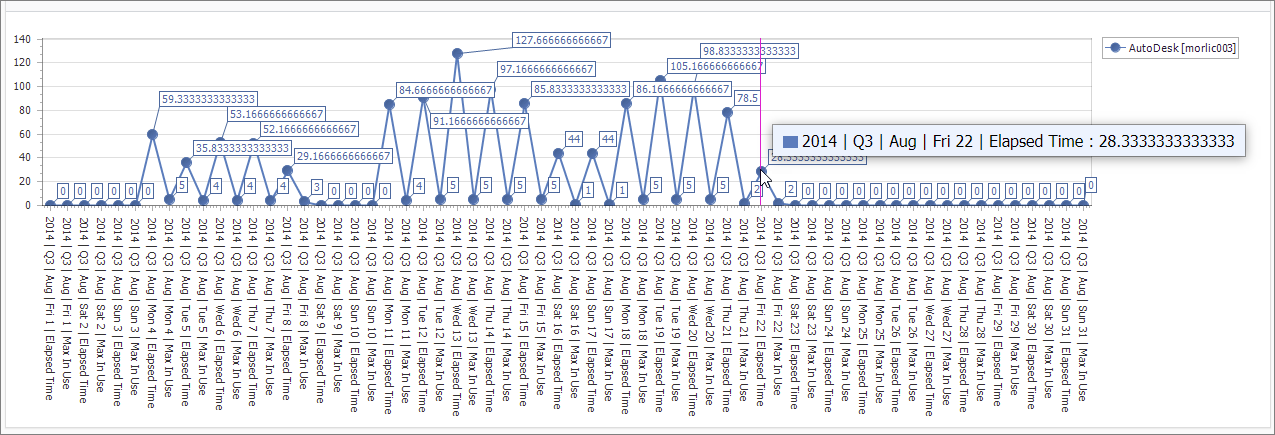
To navigate around the chart area, hover over the elements in the chart and the information card containing specific details of the pointed data should be shown.