We’re upgrading your documentation experience!
A new doc website is live at docs.openit.cloud — a temporary preview during our transition. This website is now in maintenance-only mode (only critical issues will be addressed).
Explore the new website and send us your feedback!
#
Dashboard - No data displayed
#
Problem
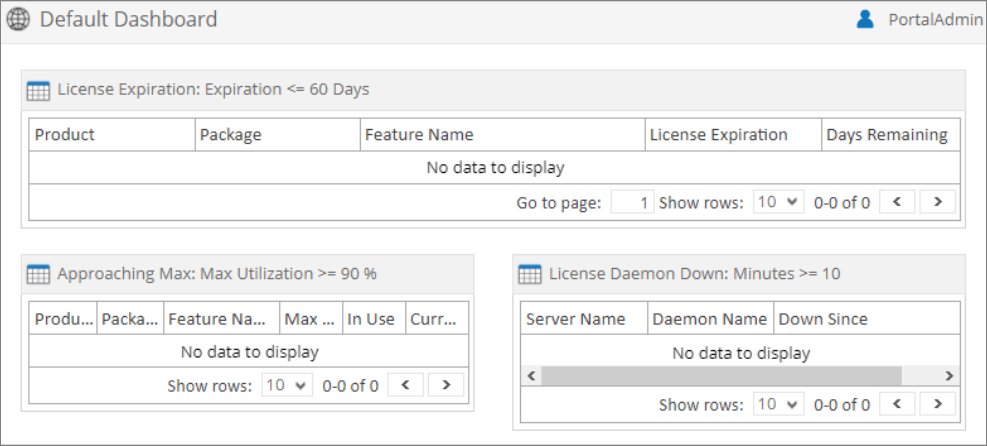
Sometimes, when creating a dashboard, there is no data displayed in portlets.
#
Resolution
Use the following list of suggestions to troubleshoot the issue:
#
Check the configured Core Server database path
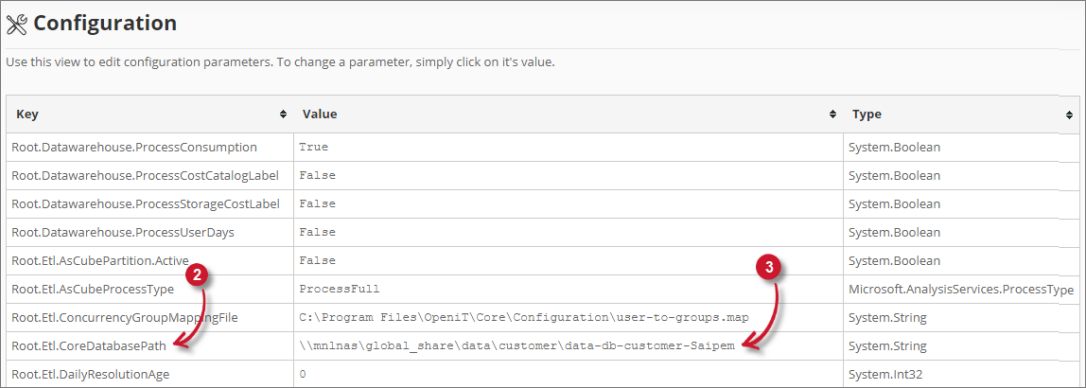
Follow these instructions to check if the configured Core Server database path is correct:
Go to the Configuration page under the Administration tab of the Analysis Server web interface.
Look for the configuration key Root.Etl.CoreDatabasePath.
Verify that the value of the key is correct.
 Analysis Server Troubleshooting: Check Core Server Database Path
If the value is incorrect, update the configuration key and execute the command RunEtl using the Analysis Server console.
#
Check if License Status data is processed successfully
Follow these instructions to check the status of the License Status processing:
Go to the Analysis Server Log directory, which is by default in
C:\Program Files\OpeniT\Analysis Server\Log.Open the
OpeniT.Server.Etl.Console.loglog file.Look for the latest execution of the job SyncLicenseStatusLabelJob
2022-12-05 19:31:08,005 +08:00 INFO SyncLicenseStatusLabelJob - Open iT Analysis
Server Version: 9.12.1 (6c4c0256)
2022-12-05 19:31:08,008 +08:00 INFO SyncLicenseStatusLabelJob - Job started.
Running as SVG\johndoe
2022-12-05 19:31:08,013 +08:00 INFO Config - License file is
valid. "core" valid until
2021-12-15 (374 days), "server_license" valid until 2021-12-15 (374 days),
"server_olapreports" valid until 2022-12-15 (9 days)
2022-12-05 19:31:08,014 +08:00 INFO SyncDataTypeJob - Open iT Analysis
Server Version: 9.12.1 (6c4c0256)
2022-12-05 19:31:08,016 +08:00 INFO SyncDataTypeJob - Job started.
Running as SVG\johndoe
2022-12-05 19:31:08,190 +08:00 INFO SyncDataTypeJob - Scanning core
server data type 999 from
\\win-host01_storage\data-db-customer-customer\license-status
2022-12-05 19:31:08,197 +08:00 INFO SyncDataTypeJob - Packet size: 32764.
Batch size: 30000
2022-12-05 19:31:08,206 +08:00 INFO SqlTableCreator - Table LicenseData
exists in the database.
2022-12-05 19:31:08,211 +08:00 INFO SqlTableCreator - Checking column
definitions for table LicenseData
2022-12-05 19:31:08,321 +08:00 INFO SyncDataTypeJob - Loading 0 files...
2022-12-05 19:31:08,328 +08:00 INFO SyncDataTypeJob - Loaded a total
of 0 records. Average
throughput for datatype 999: 0 records/min
2022-12-05 19:31:08,331 +08:00 INFO SyncDataTypeJob - Job done.
Duration 00.31s
2022-12-05 19:31:08,439 +08:00 INFO SyncLicenseStatusLabelJob - Finished running
procedure
ProcessLicenseData. Affected rows: 992.
2022-12-05 19:31:08,442 +08:00 INFO SyncLicenseStatusLabelJob - Job done.
Duration 00.43s
Verify that job is successful and has loaded the data.
If ERRORS occurred, try to execute again the command SyncLicenseStatus /reload. If errors persist, please send the log file to support@openit.com for response.
#
Check if License Status data is available
Follow these instructions to check if the License Status data is available in the Core Server database:
Go to the Configuration page under the Analysis Server Administration tab.
Look for the configuration key Root.Etl.CoreDatabasePath.
Analysis Server Troubleshooting: Check Core Server Database Path
Navigate to the value of the configuration key.
Open the folder
license-statusand verify if a.gzfile is available.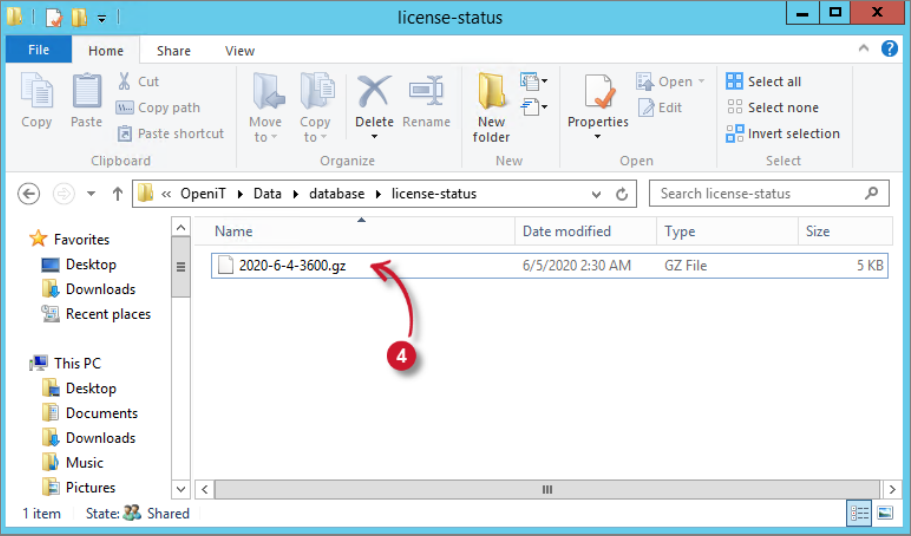 Analysis Server Troubleshooting: Check License Status File
If not available, check the Core Server to see why it is not generating license status data.
#
Check for Web Browser Console Errors
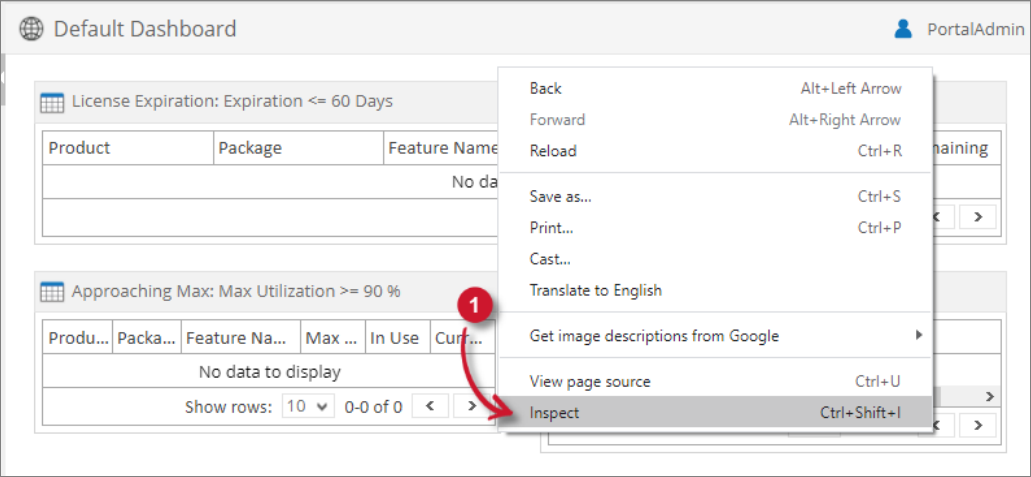
Follow these instructions to check for errors in the web browser console:
In the Dashboard page, right-click anywhere inside the page and choose Inspect.
 Analysis Server Troubleshooting: Inspect Web Browser
The Developer Tools should appear.
Choose Console from the available tabs of the tool.
The Console lists web browser transactions including errors.
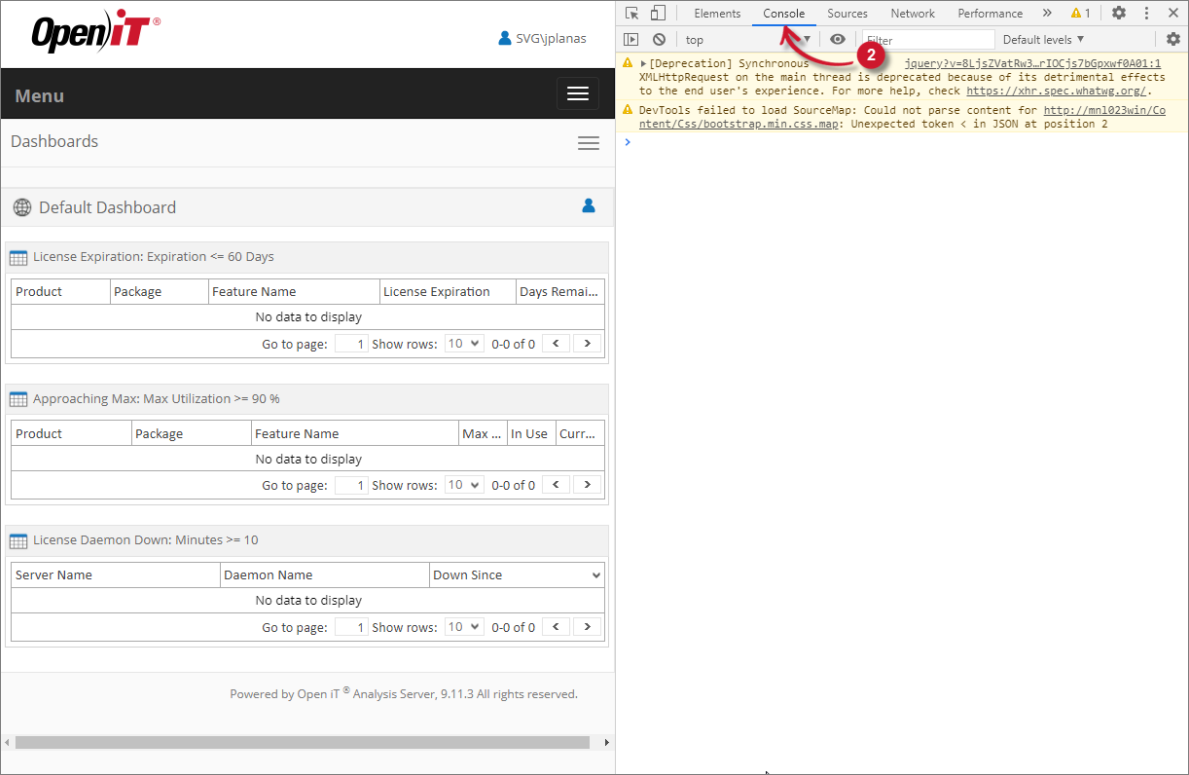 Analysis Server Troubleshooting: Check Web Browser Console Errors
Errors in the console may sometimes be too technical. For immediate response, send the error details to support@openit.com.