We’re upgrading your documentation experience!
A new doc website is live at docs.openit.cloud — a temporary preview during our transition. This website is now in maintenance-only mode (only critical issues will be addressed).
Explore the new website and send us your feedback!
#
Report Creation and Publishing
This section covers essential steps in creating and publishing reports in Power BI.
#
Creating a Basic Report using Power BI
Make sure that the Power BI data connection is established before creating a report.
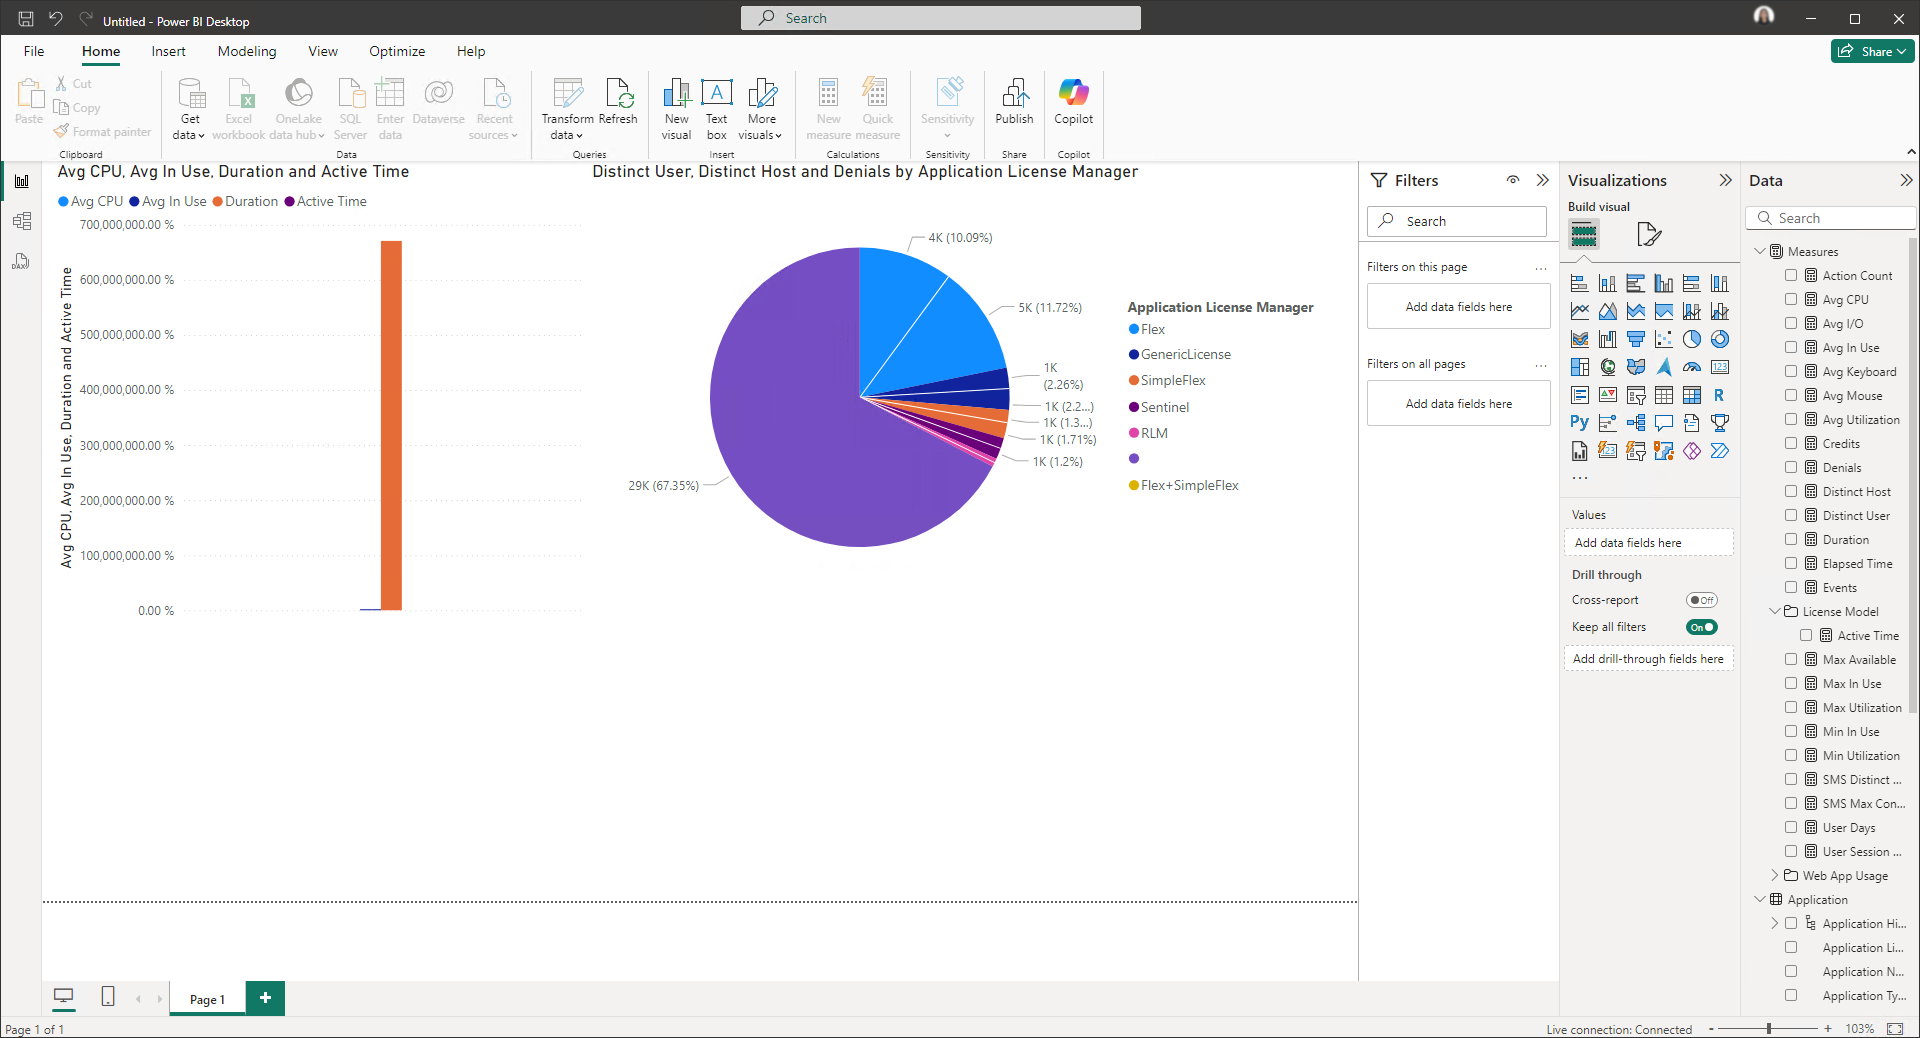
Drag a field to the canvas to start a new visualization to create a simple report, or drag fields to an existing visualization. Ticking the check box next to the field automatically adds that field to the active visualization.
Select a different visualization type from the Visualization pane and use the Filter pane to view, set, and modify persistent filters to the reports.
#
Publishing a Report to Power BI
To allow others within your organization to view the report, you must publish it to your Power BI account in the cloud. This guide will walk you through the steps to publish a report to Power BI.
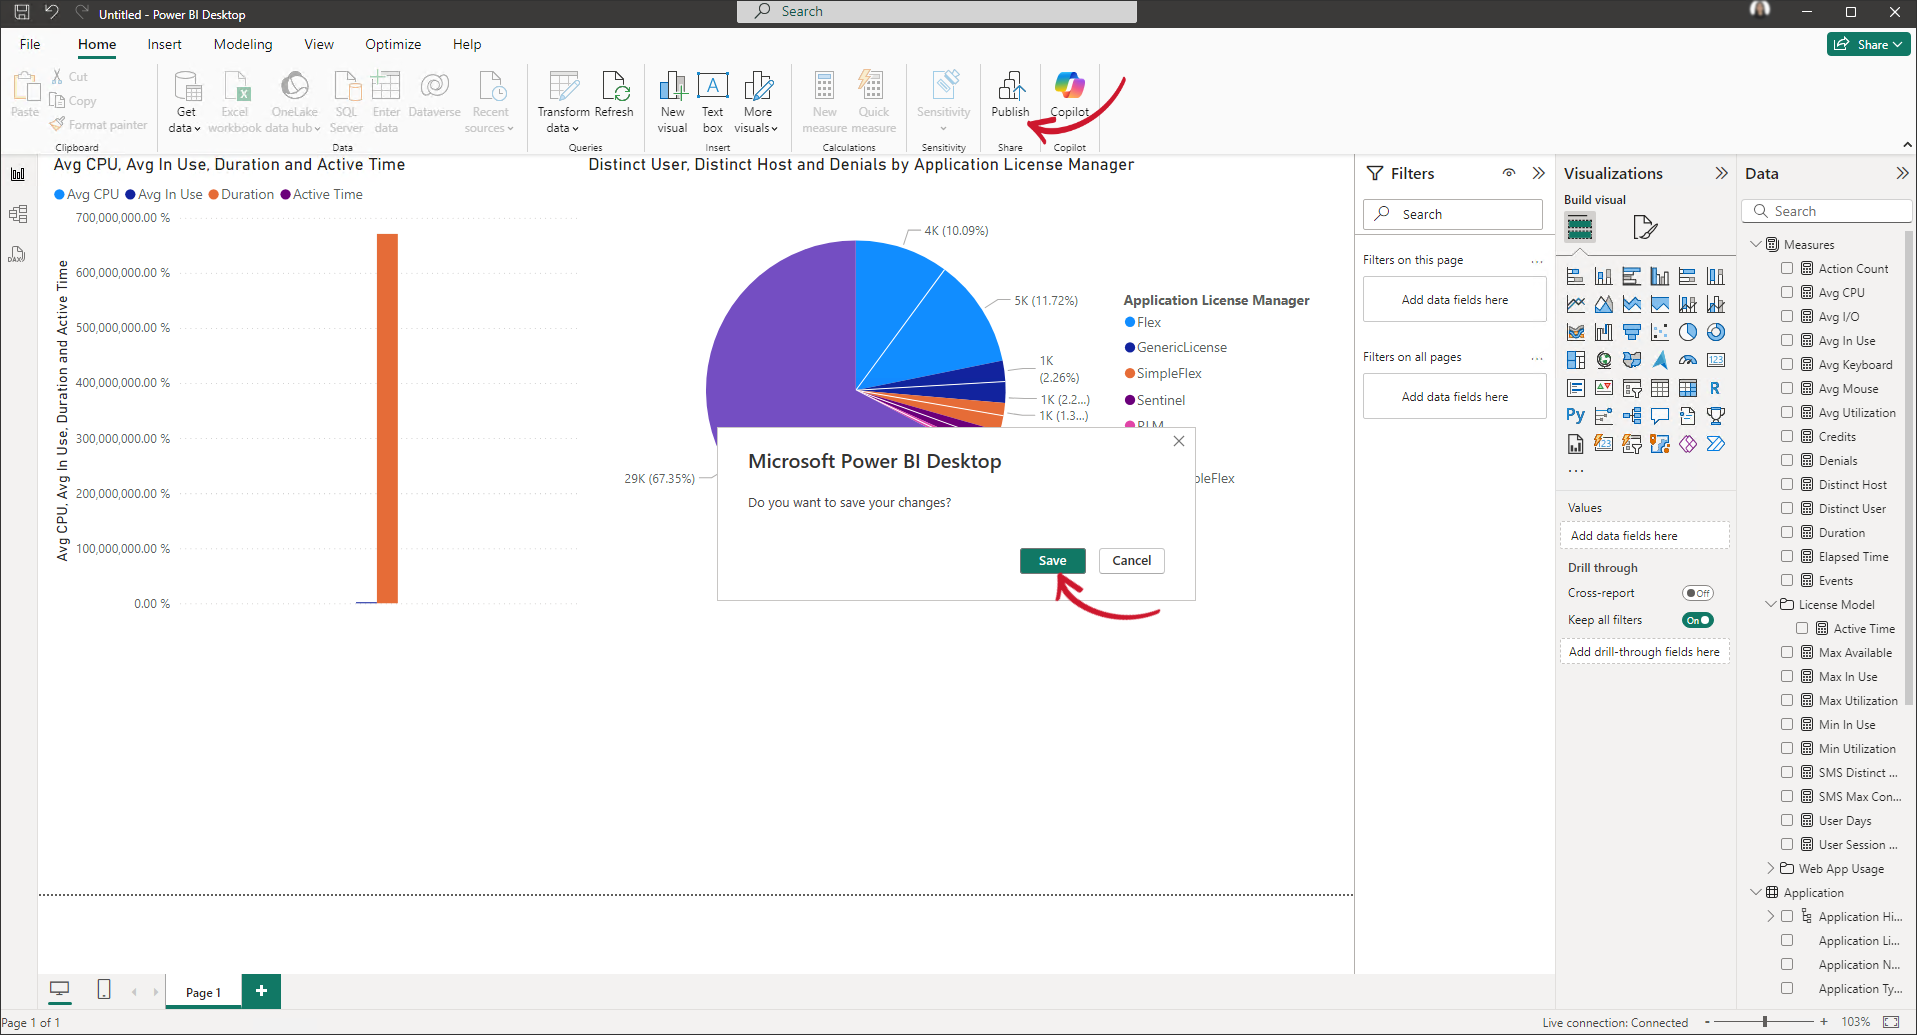
In the Home tab, under the Share ribbon, click Publish.
A pop-up message will appear, prompting you to save the report. Click Save.
 Power BI: Publishing a Report
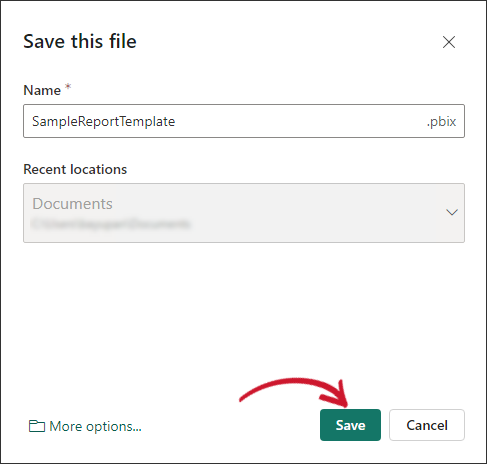
Enter the desired name for the report, then click Save.
 Power BI: Saving a Report
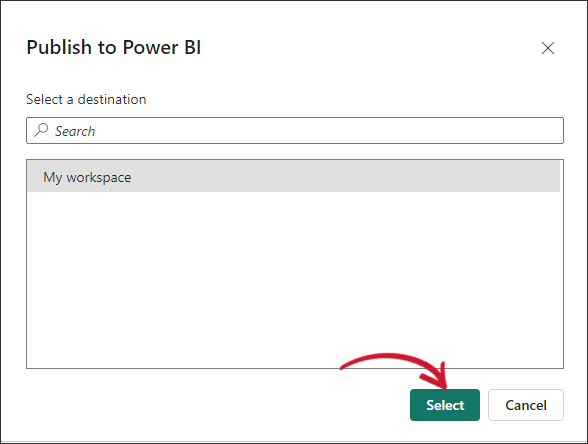
Select My workspace as the destination for the report to be published.
 Power BI: Publish to Power BI
Your report has now been published but is disconnected from the gateway.
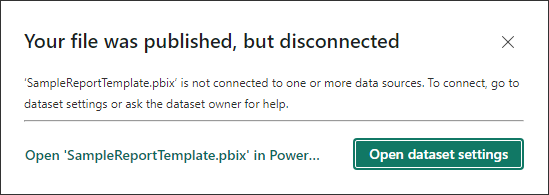 Power BI: Published Report Disconnected
If you open the dataset settings, you will be directed to Power BI on the web, where you can select an existing gateway and cloud connections.
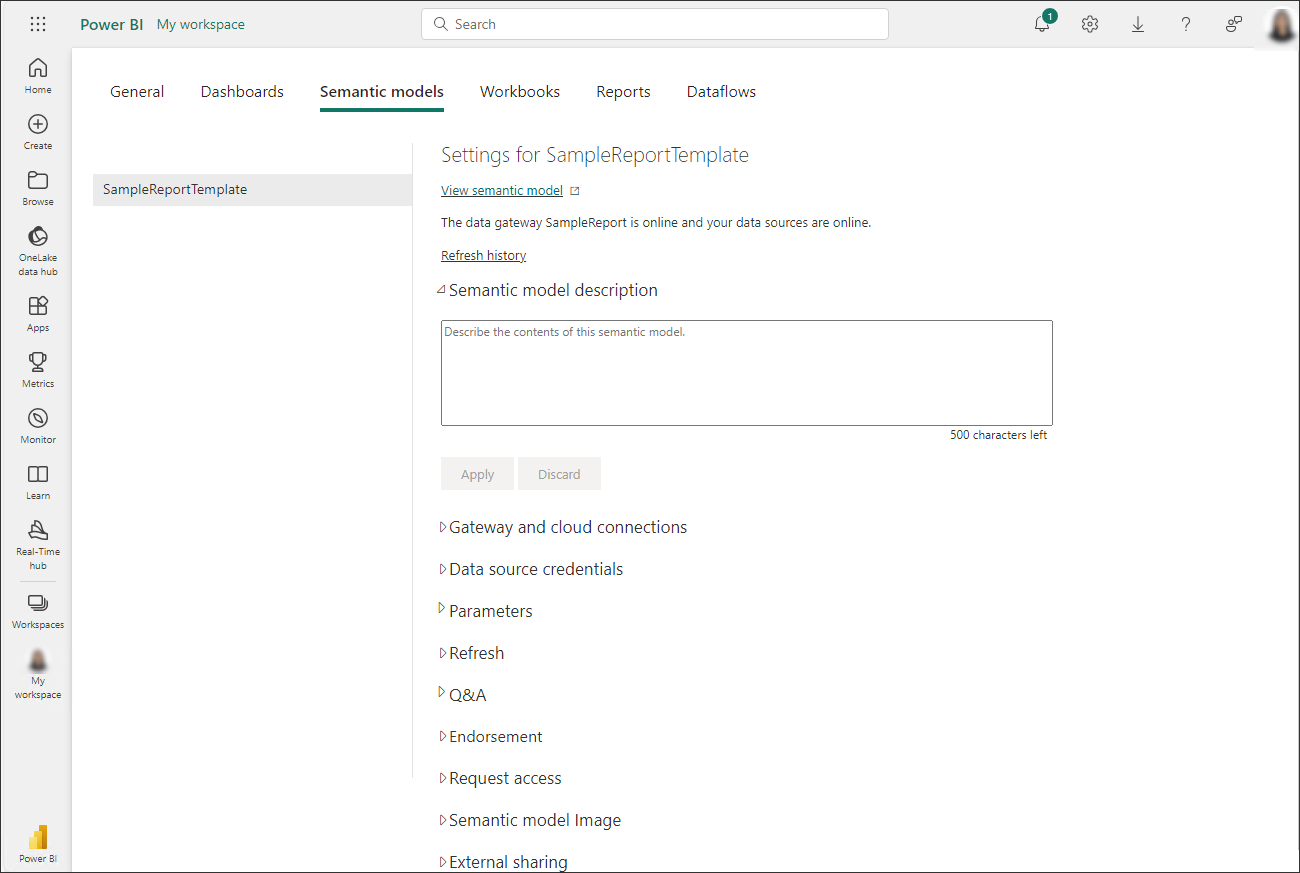 Power BI: Dataset Setiings
If the gateway and cloud connections have not been created, choose to open the report file. This will direct you to Power BI on the web, where the report will appear blank with a message above stating: No gateway selected to access the data source openit.
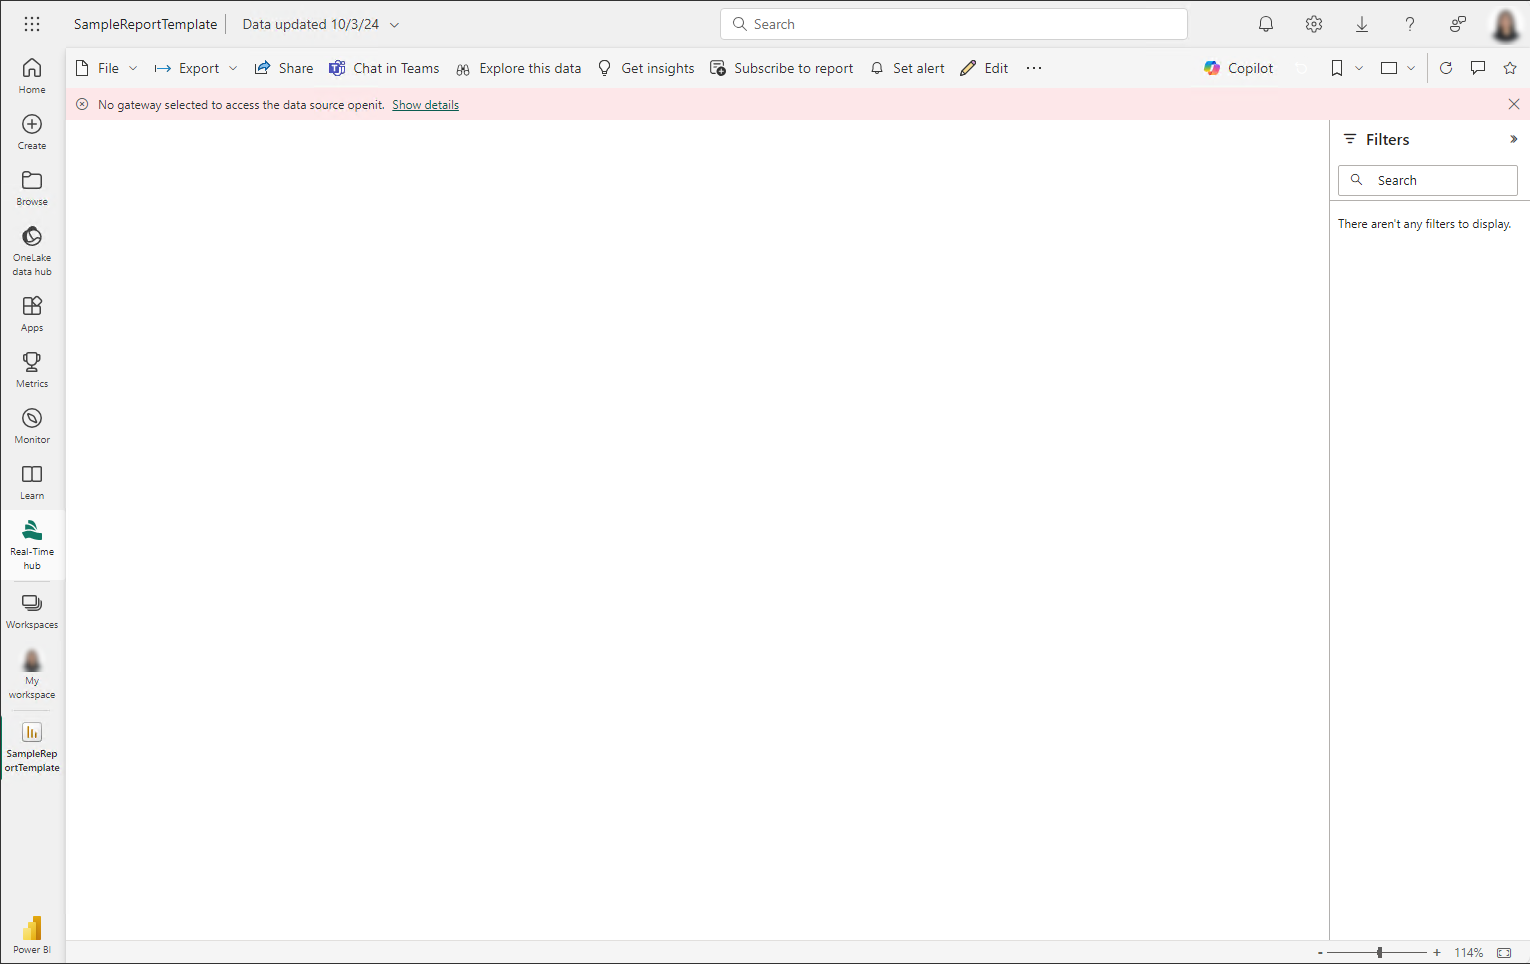 Power BI: Publish to Power BI
You must set up and configure your data gateway. Follow the instructions on Configuring On-premises Data Gateway